
Brightlio has compiled 316 data center statistics for 2026, spanning global market growth, AI and hyperscale infrastructure, IT spending, electricity and water use, investment, construction, and regional trends. The article is organized into six sections:
- Global Data Center Statistics for 2026
- Data Center Market Size and Growth Statistics
- AI Data Center Statistics
- Data Center IT Spending Statistics
- Data Center Electricity, Power, and Water Statistics
- Data Center Statistics by Region: Africa, Asia, Australia, Europe, North America, and South America
Without further ado, let’s check out the stats!
Global Data Center Market Statistics
- More than 11,700 operational data centers were recorded worldwide as of May 2026. The United States accounted for 5,427, or 46% of the global total. (Source: Statista)
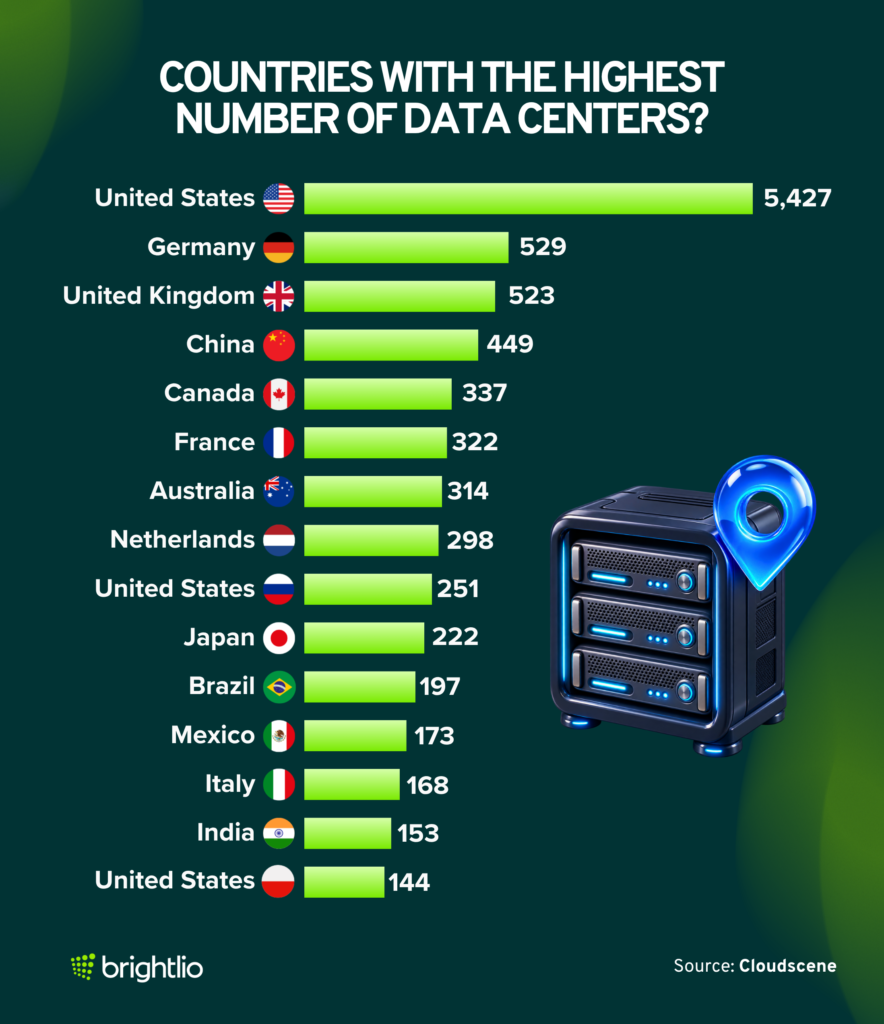
- The countries with the most data centers in 2026 are:
- United States: 5,427
- Germany: 529
- United Kingdom: 523
- China: 449
- Canada: 337
- France: 322
- Australia: 314
- Netherlands: 298
- Russia: 251
- Japan: 222
- Brazil: 197
- Mexico: 173
- Italy: 168
- India: 155
- Poland: 144
(Source: Statista)
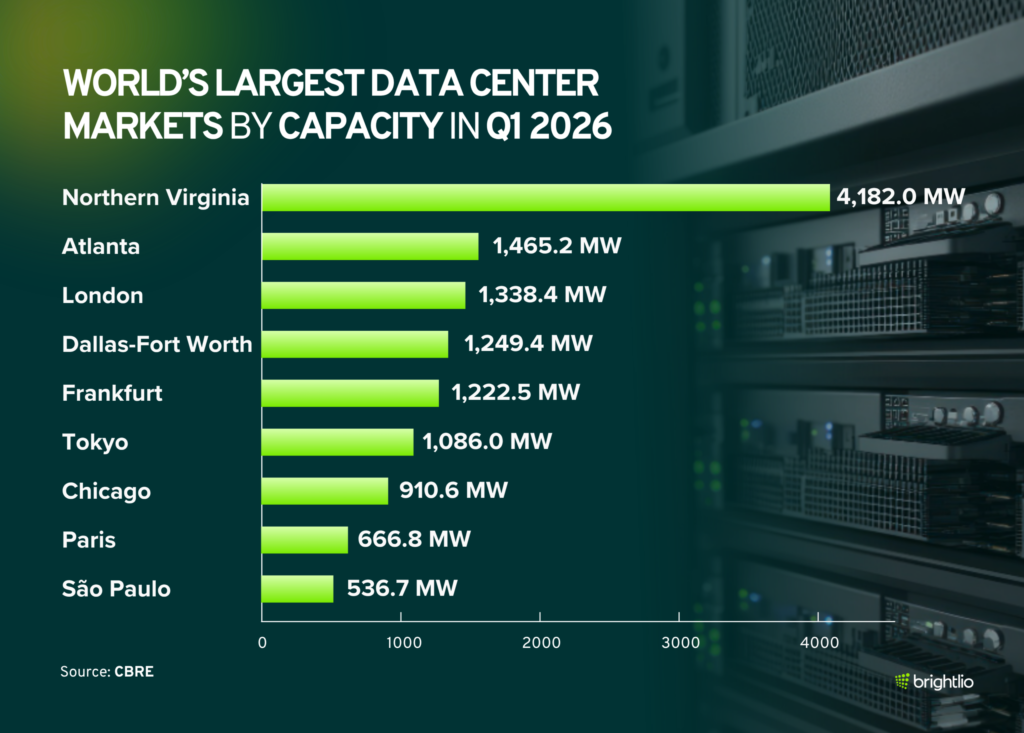
- Northern Virginia remained the world’s largest data center market in Q1 2026. The leading markets by inventory were:
- Northern Virginia: 4,182.0 MW
- Atlanta: 1,465.2 MW
- London: 1,338.4 MW
- Dallas-Fort Worth: 1,249.4 MW
- Frankfurt: 1,222.5 MW
- Tokyo: 1,086.0 MW
- Sydney: 950.0 MW
- Chicago: 910.6 MW
- Singapore: 821.0 MW
- Hong Kong: 687.0 MW
- Paris: 666.8 MW
- Amsterdam: 634.0 MW
- São Paulo: 536.7 MW
- Northern Virginia added 1,135.9 MW of inventory year over year. (Source: CBRE)
- The global data center market is projected to reach US$538.91 billion in 2026 and grow at an 8.48% CAGR to US$809.59 billion by 2031. The United States is projected to generate US$168.51 billion in 2026, the largest share of any country. (Source: Statista)
- Global data center capacity is projected to nearly double from 103 GW in 2025 to 200 GW by 2030, representing a 14% CAGR. (Source: JLL)
- The global data center infrastructure market is valued at $256.2 billion in 2026 and is projected to reach $789.8 billion by 2035, representing a 12.1% CAGR. AI computing, hyperscale cloud expansion, edge infrastructure, and 5G are major growth drivers. (Source: Global Market Insights)
- Global data center supply across the 16 largest markets reached 16 GW in Q1 2026, up 25% year over year. Average vacancy fell from 8.3% to 6.7% as demand continued to absorb new capacity. (Source: CBRE)
- Northern Virginia remained the world’s largest data center market in Q1 2026. The leading markets by inventory were:
- Northern Virginia: 4,182.0 MWAtlanta: 1,465.2 MWLondon: 1,338.4 MWDallas-Fort Worth: 1,249.4 MWFrankfurt: 1,222.5 MWTokyo: 1,086.0 MWSydney: 950.0 MWChicago: 910.6 MWSingapore: 821.0 MWHong Kong: 687.0 MWParis: 666.8 MWAmsterdam: 634.0 MWSão Paulo: 536.7 MW
- Combined data center capital expenditures from Amazon, Google, Meta, and Microsoft are approaching $600 billion, driven largely by AI computing, networking, storage, power, and cooling infrastructure. (Source: Dell’Oro Group)
- NVIDIA’s Data Center revenue reached a record $75.2 billion in the quarter ended April 26, 2026, up 92% year over year. (Source: NVIDIA)
- The global data center construction market is projected to grow from $287.5 billion in 2026 to $662.7 billion by 2033, representing a 12.7% CAGR. Average global construction costs are projected to rise 6% to $11.3 million per MW in 2026, while AI infrastructure fit-outs can add as much as $25 million per MW beyond shell-and-core construction costs. (Sources: Grand View Research; JLL)
- The global data center services market is valued at $172.2 billion in 2026 and is projected to reach $422.16 billion by 2032, representing a 16.12% CAGR. (Source: Mordor Intelligence)
- The global data center colocation market is projected to grow from $99.2 billion in 2026 to $184.4 billion by 2033, representing a 9.3% CAGR. Retail colocation accounted for 69.2% of the market in 2025. (Source: Grand View Research)
- The global modular data center market is valued at $42.65 billion in 2026 and is projected to reach $101.22 billion by 2031, representing an 18.87% CAGR. (Source: Mordor Intelligence)
- The global edge data center market is projected to grow from $59.60 billion in 2026 to $162.48 billion by 2032, representing an 18.12% CAGR. (Source: Research and Markets)
- The global data center infrastructure management market is projected to grow from $4.28 billion in 2026 to $9.89 billion by 2031, representing an 18.25% CAGR. (Source: Research and Markets)
- The global data center power market is projected to grow from $25.8 billion in 2026 to $71.8 billion by 2033, representing a 15.7% CAGR. (Source: Grand View Research)
- Network infrastructure was the largest segment of the global data center market by revenue in 2025, reaching approximately US$254.80 billion. (Source: Statista)
- IT and telecommunications accounted for 39.85% of global data center capacity in 2025, making it the largest end-user segment. (Source: Mordor Intelligence)
- Hyperscale operators ran 1,360 large data centers worldwide at the end of 2025 and controlled 48% of global data center capacity. Enterprise on-premises facilities accounted for 32%, while non-hyperscale colocation accounted for 20%. (Source: Synergy Research Group)
- Almost 800 hyperscale data centers are in the global development pipeline, and hyperscale operators are projected to control 67% of global data center capacity by 2031. (Source: Synergy Research Group)
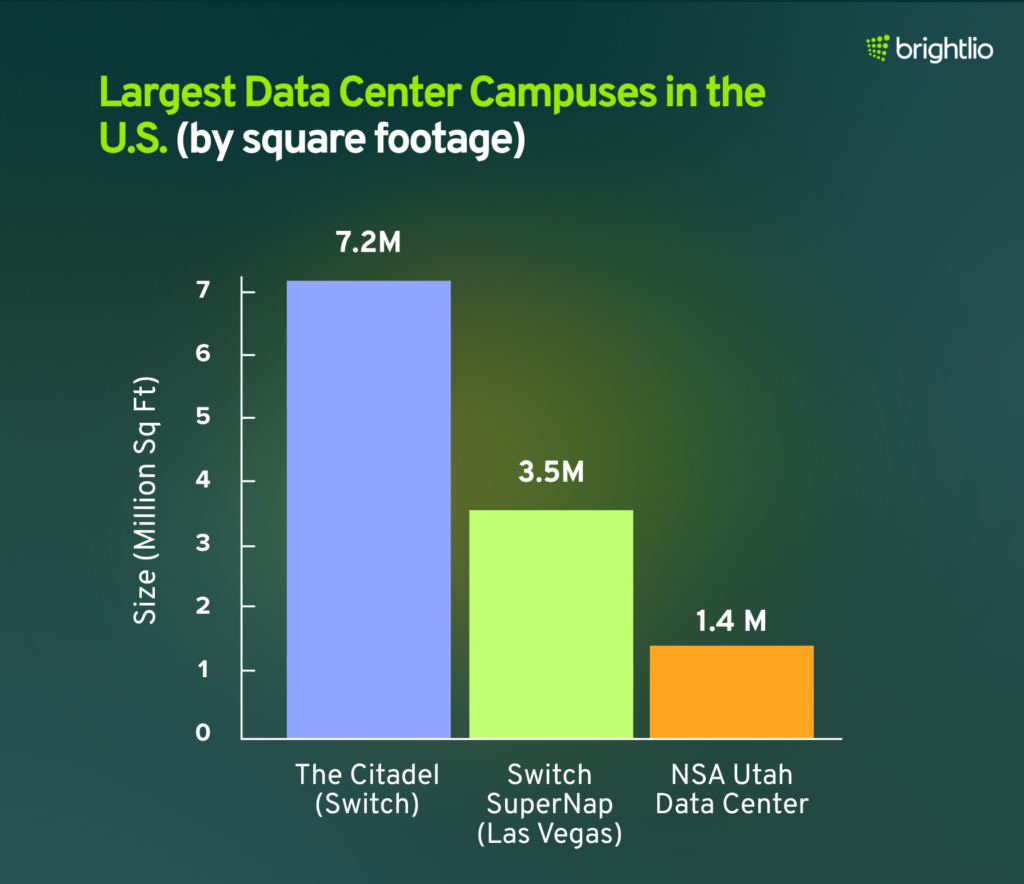
- Switch’s Tahoe Reno 1 facility encompasses up to 1.3 million square feet and provides up to 130 MW of power capacity. (Source: Switch)
- Switch’s Tahoe Reno Citadel Campus is designed to reach up to 17.4 million square feet of data center space and 850 MW of power capacity at full buildout. (Source: Switch)
- China Telecom’s Inner Mongolia Information Park has a published full-project figure of approximately 10.8 million square feet. The figure represents the full project scale rather than a confirmed completed operational footprint. (Source: Data Center Dynamics)
- More than half of data center operators had difficulty finding qualified candidates for open positions in 2026, highlighting persistent staffing and skills shortages across the industry. (Source: Uptime Institute)
- Approximately 1 in 10 data center outages still results in a serious or severe impact, despite a long-term decline in impactful outages. (Source: Uptime Institute)
- 1 in 5 impactful data center outages cost more than $1 million for the second consecutive year. Among operators reporting a major outage, 57% said their most recent incident cost more than $100,000. (Source: Uptime Institute)
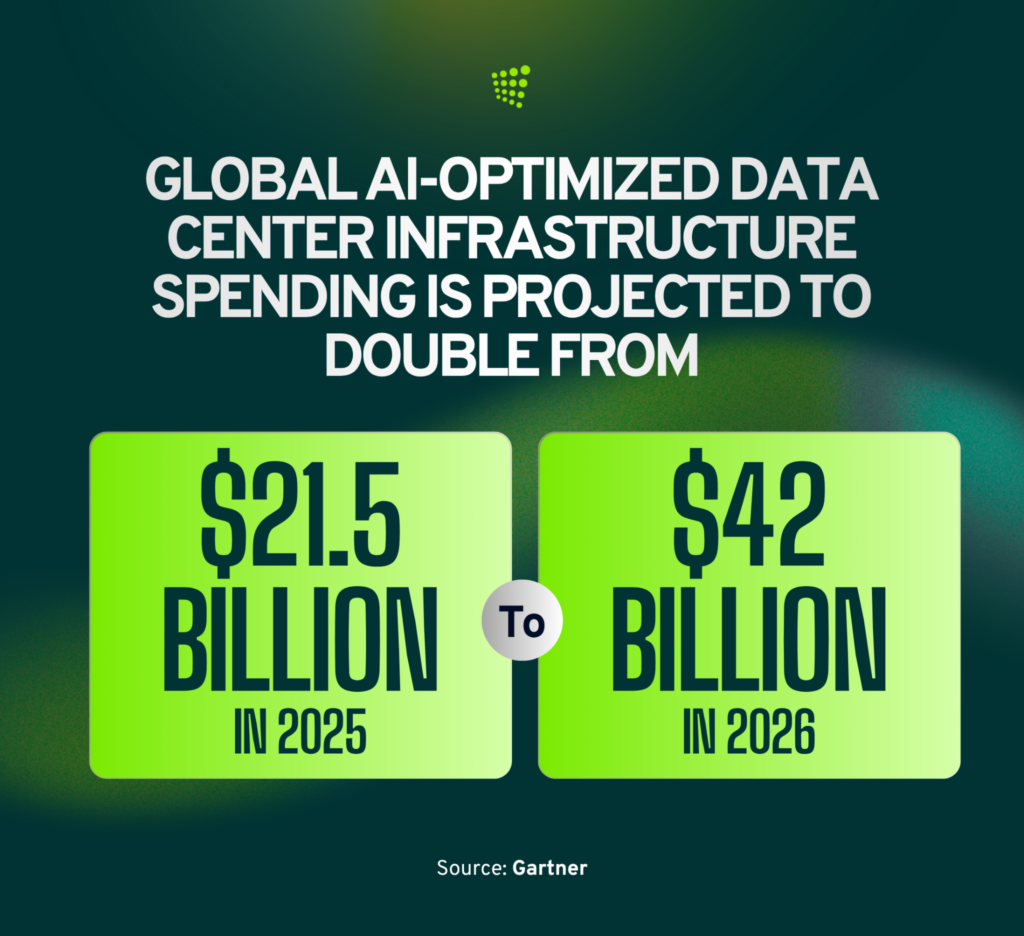
- Global AI-optimized infrastructure as a service (IaaS) spending is projected to rise from $21.5 billion in 2025 to $42.3billion in 2026. (Source: Gartner)
AI Data Center Statistics
- Capital expenditures from five major technology companies exceeded $400 billion in 2025 and are projected to increase another 75% in 2026. Their combined spending now exceeds worldwide investment in oil and natural gas production. (Source: IEA)
- Global capacity from advanced data centers built specifically as AI factories more than tripled in the 18 monthspreceding April 2026. (Source: IEA)
- Amazon increased its planned 2026 capital spending to $220 billion, up from $200 billion, with AI infrastructure, robotics, semiconductors, and other technology investments driving the increase. (Source: Associated Press)
- Microsoft plans to invest approximately $190 billion in capital expenditures during calendar year 2026 as it expands GPU, CPU, storage, cloud, and AI infrastructure capacity. (Source: Microsoft)
- Meta expects 2026 capital expenditures of $130–145 billion, including principal payments on finance leases, as it expands infrastructure for AI and its core services. (Source: Meta)
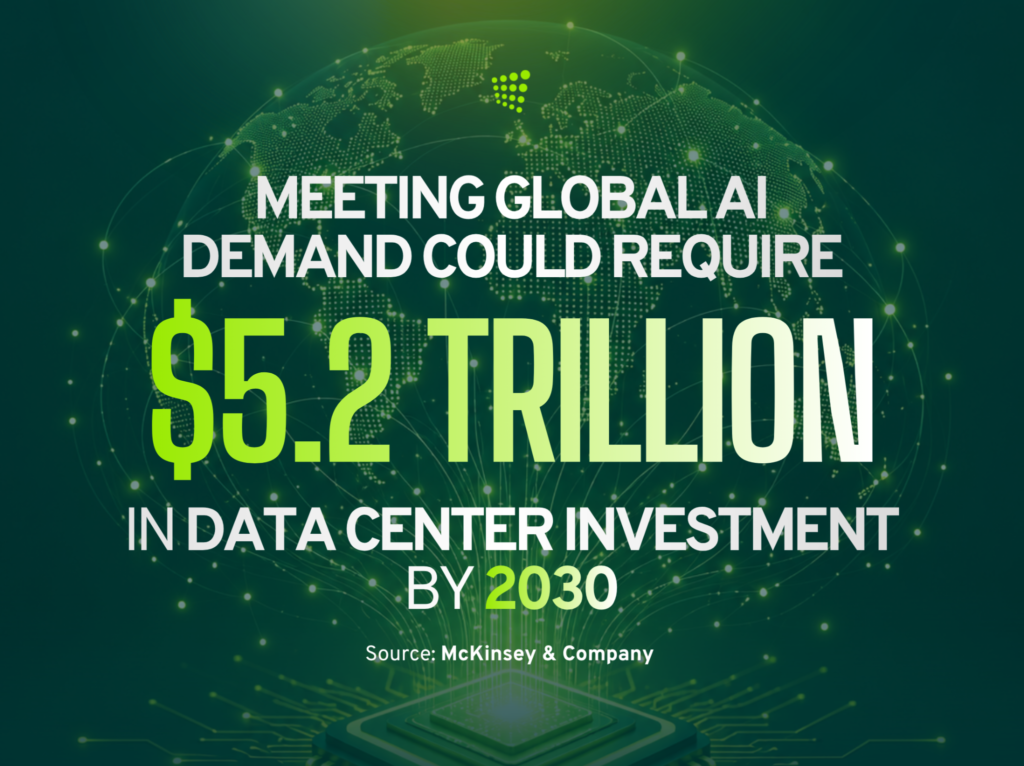
- Meeting worldwide AI compute demand could require approximately $5.2 trillion in data center investment and 156 GW of AI-related capacity by 2030. Around 60% of the investment would go toward chips and computing hardware, 25% toward power, cooling, and electrical infrastructure, and 15% toward land, materials, and site development. (Source: McKinsey & Company)
- Stargate has surpassed 10 GW of secured U.S. AI infrastructure capacity, reaching its original capacity target more than two years ahead of schedule. The initiative was launched with a commitment to invest $500 billion in U.S. AI infrastructure over four years. (Sources: OpenAI; OpenAI — Stargate Announcement)
- AI data center workloads accounted for approximately 25% of total data center workloads in 2025 and could represent 50% by 2030. (Source: JLL)
- AI inference workloads could overtake model training as the largest source of AI data center demand in 2027, as AI use shifts from periodic model training toward continuous application usage. (Source: JLL)
- Grid-connection timelines in major data center markets now average four years or longer, forcing AI and hyperscale developers to secure power years before facilities enter service. (Source: JLL)
- Grid constraints could delay approximately 20% of global data center capacity planned for construction through 2030. (Source: IEA)
- AI server power density increased 11-fold between 2020 and 2025 and could increase another fourfold by 2027. A single advanced server rack could then have peak power demand comparable to 65 households. (Source: IEA)
- High-density GPU racks commonly require 40–130 kW of power, while future AI chip systems could push rack demand toward 250 kW, accelerating the transition toward direct-to-chip and immersion cooling. (Source: JLL)
- Data centers could deploy approximately 20–25 GW of battery storage worldwide by 2030 to manage the rapid fluctuations in electricity demand created by AI training and inference workloads. (Source: IEA)
- AI infrastructure spending reached $89.7 billion in the first quarter of 2026, representing year-over-year growth of 33.1%. (Source: IDC)
- Full-year AI infrastructure spending is projected to reach $497 billion in 2026, approximately 56% above the $318 billion spent in 2025. Spending is projected to exceed $1 trillion in 2029 and reach approximately $1.21 trillion by 2030. (Source: IDC)
- Servers accounted for $87.6 billion, or 97.6%, of AI infrastructure spending in the first quarter of 2026. Storage accounted for $2.2 billion, or 2.4%. Hyperconvergence’s 2026 server statistics put this AI hardware spending in the wider server market context. (Source: IDC)
- Cumulative spending on switches for AI back-end networks is projected to approach $1 trillion from 2026 through 2030. Scale-up networking could account for more than 50% of the market by 2030. (Source: Dell’Oro Group)
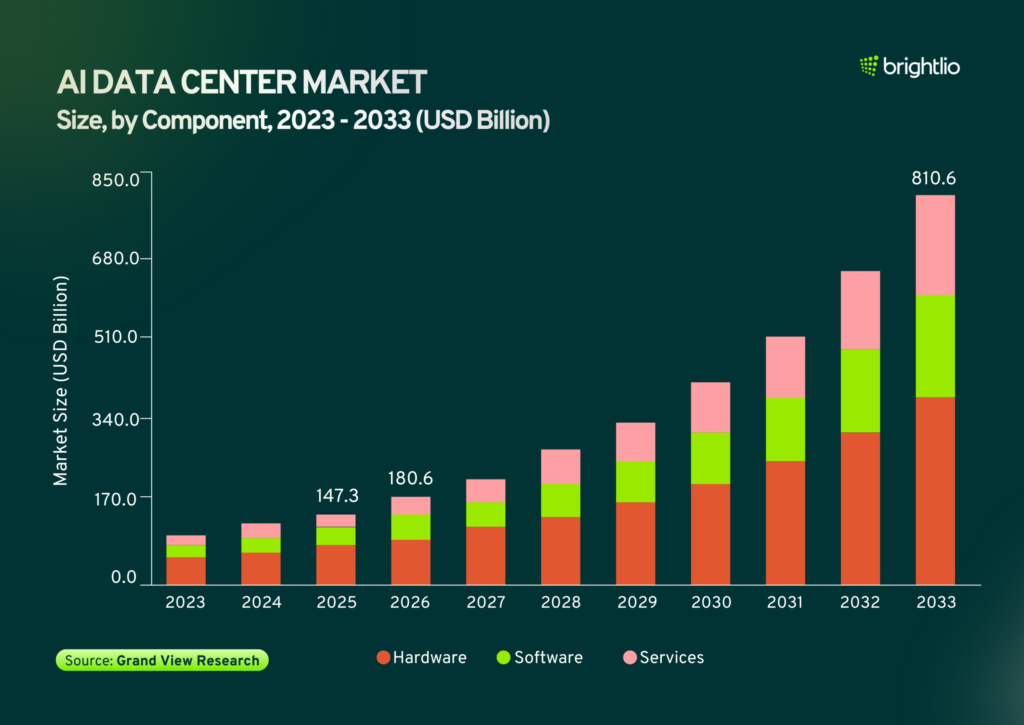
Data Center IT Spending Statistics
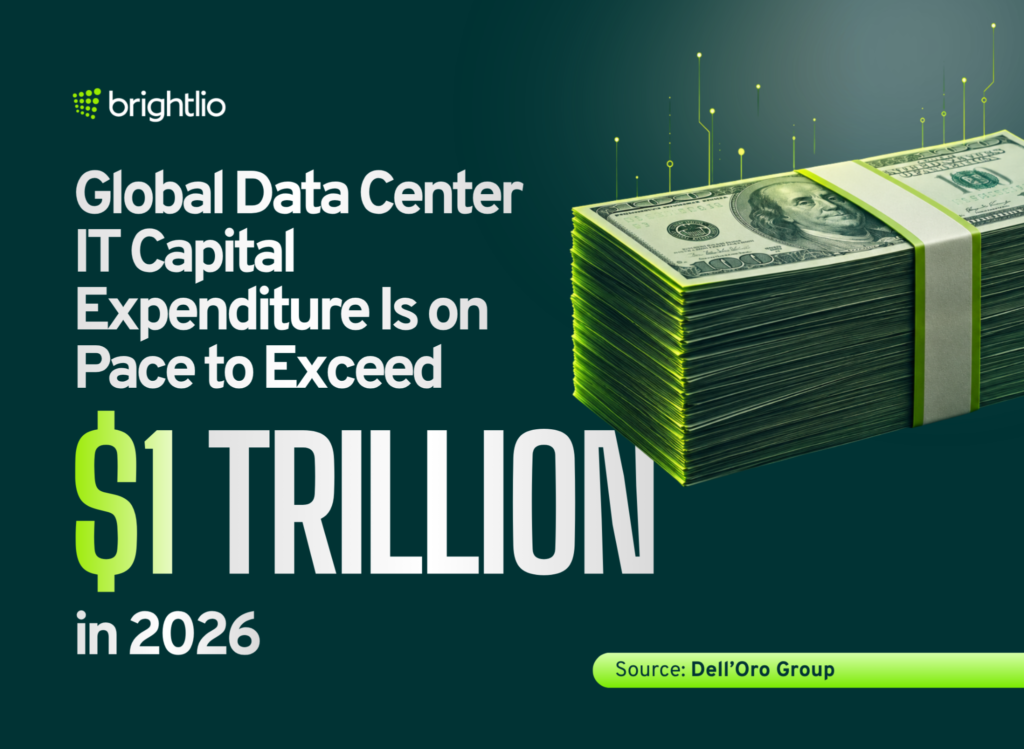
- Worldwide spending on data center systems is projected to increase from $506 billion in 2025 to $822 billion in 2026, representing annual growth of 62.5%. (Source: Gartner)
- Global data center IT capital expenditure is on pace to exceed $1 trillion in 2026 as spending on servers, storage, networking, and other infrastructure continues to accelerate. (Source: Dell’Oro Group)
- Global data center investment could approach $3 trillion through 2030. Around $1.2 trillion would go toward real estate asset creation, while tenants could spend another $1–2 trillion on GPUs, servers, networking equipment, and other IT infrastructure. (Source: JLL)
- Worldwide infrastructure-as-a-service spending is projected to increase from $222 billion in 2025 to $287 billion in 2026, representing growth of 29.3%. (Source: Gartner)
- The worldwide server market is projected to reach approximately $647 billion in 2026, up 42.7%, before increasing to approximately $931 billion in 2027. (Source: IDC)
- Worldwide external enterprise storage revenue reached $9.2 billion in the first quarter of 2026, up 22.7% year over year as AI storage demand and deferred infrastructure refreshes increased spending. (Source: IDC)
- Worldwide revenue from data center IT semiconductors and components used in servers and storage systems increased 182% year over year in the second quarter of 2026. DRAM and storage-drive revenue grew at a triple-digit rate as memory prices and AI infrastructure demand increased. (Source: Dell’Oro Group)
- The global data center IT semiconductor and component market is projected to reach $1.8 trillion by 2030, driven by AI accelerators, CPUs, memory, storage devices, and network interface cards. (Source: Dell’Oro Group)
- The data center physical infrastructure market generated $12 billion in manufacturer revenue during the first quarter of 2026, an increase of 28% year over year. The market includes power, cooling, racks, and infrastructure-management systems. (Source: Dell’Oro Group)
- Worldwide data center physical infrastructure revenue is projected to grow at a 22% CAGR from 2025 through 2030, reaching approximately $120 billion by the end of the period. (Source: Dell’Oro Group)
Data Center Cooling and Rack Density Statistics
- 81% of data center operators place the point where air cooling becomes too costly or inefficient at 20 kW per rack or higher, increasing the need for direct liquid cooling at higher rack densities. (Source: Uptime Institute)
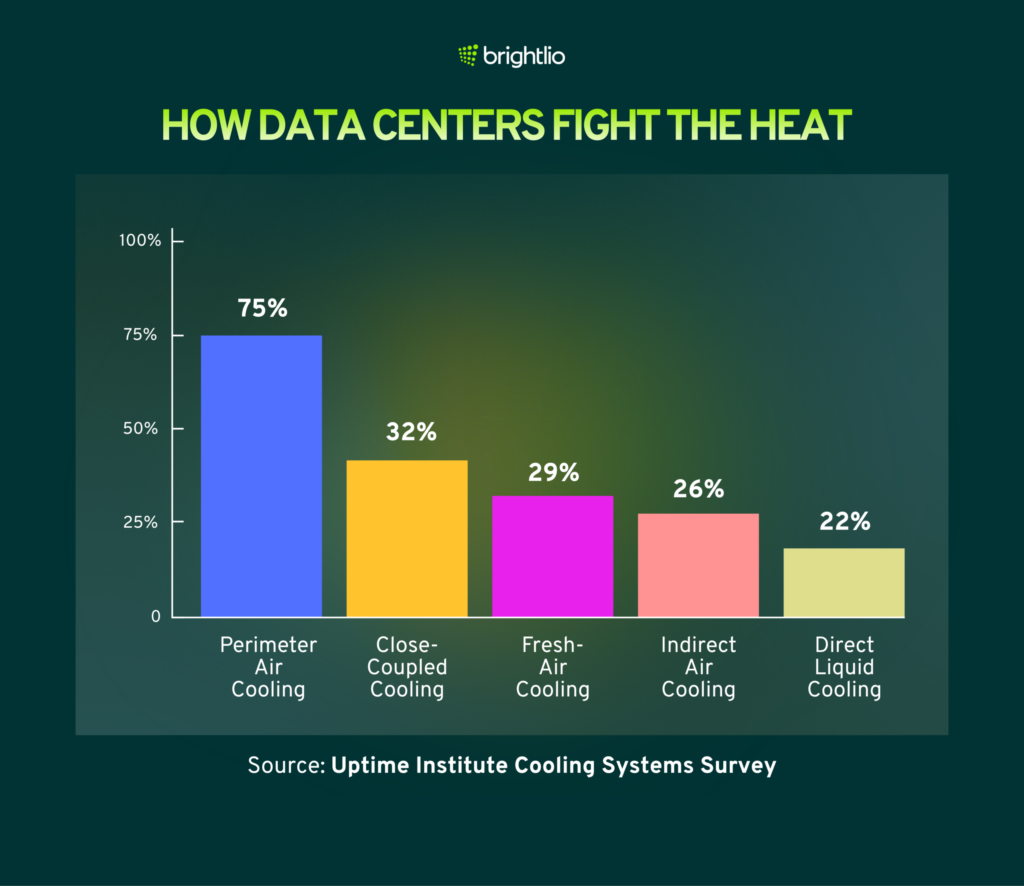
- Data centers use the following cooling methods:
- Perimeter air cooling: 75%
- Close-coupled cooling: 32%
- Fresh-air cooling: 29%
- Indirect air cooling: 26%
- Direct liquid cooling: 22%(Source: Uptime Institute)
- Direct liquid cooling adoption is driven by the following factors:
- Higher rack density: 69%
- High-powered servers: 48%
- Electricity costs: 27%
- Environmental sustainability: 22%(Source: Uptime Institute)
- Operators consider these factors when deciding whether to use direct liquid cooling:
- Ease of upgrading existing systems: 46%
- Lower running costs: 39%
- Ease of maintenance: 35%
- Backup systems: 35%(Source: Uptime Institute)
- Operators face these barriers to adopting liquid cooling:
- Lack of common standards: 39%
- High costs: 38%
- Reliability concerns: 35%
- Limited equipment and vendor options: 26%
- Maintenance issues: 26% (Source: Uptime Institute)
- Data centers use these systems to release heat outside:
- Air-cooled chillers: 35%
- Direct-expansion systems: 22%
- Evaporative cooling towers: 19%
- Fluid or dry coolers: 11%
- Fresh-air systems: 6%
- Adiabatic systems: 4% (Source: Uptime Institute)
- Operators consider these sustainability factors when choosing a data center cooling system:
- Energy efficiency: 87%
- Coolants or refrigerants with low environmental impact: 35%
- Little or no water use: 35%
- Low carbon emissions from manufacturing and construction: 29% (Source: Uptime Institute)
- Enterprise data center decision-makers plan to move toward liquid cooling on these timelines:
- Within the next year: 21%, up from 13% in the previous survey
- Within the following two to four years: 25% (Source: S&P Global)
- Global data center liquid-cooling manufacturer revenue is projected to increase from $3 billion in 2025 to $7 billion by 2029 as AI infrastructure drives higher cooling requirements. (Source: Dell’Oro Group)
- Thermal design power for leading-edge GPUs is projected to exceed 4,000 W by 2029, increasing cooling requirements for high-performance data centers. (Source: Dell’Oro Group)
- Data center thermal-management manufacturer revenue increased 50% year over year in the first quarter of 2026, making thermal management the fastest-growing segment of the physical data center infrastructure market. (Source: Dell’Oro Group)
Data Center Electricity, Power, and Water Statistics
- Global data center electricity consumption increased 17% in 2025 to approximately 485 TWh. Consumption is projected to roughly double to 950 TWh by 2030, accounting for around 3% of global electricity demand. (Source: IEA)
- Data centers are projected to account for slightly less than 10% of total global electricity-demand growth through 2030. Their share rises to around 19% across advanced economies. (Source: IEA)
- U.S. data centers are projected to consume approximately 649 TWh of electricity in 2030, equal to about 11.8%of total U.S. electricity use. Depending on AI hardware deployment, utilization, and efficiency, consumption could range from 521 TWh to 843 TWh, or 9.5% to 15.3% of national electricity use. (Source: Lawrence Berkeley National Laboratory)
- U.S. data center electricity consumption per person could increase from approximately 540 kWh in 2024 to more than 1,200 kWh by 2030. That would equal roughly 10% of the annual electricity consumption of an average U.S. household. (Source: IEA)
- Electricity consumption from AI-focused data centers increased 50% in 2025 and is projected to triple between 2025 and 2030. (Source: IEA)
- Electricity consumption from accelerated servers is projected to grow by approximately 30% per year through 2030, compared with around 9% per year for conventional servers. Accelerated servers could account for almost 50% of the net increase in global data center electricity consumption. (Source: IEA)
- The United States and China are expected to account for nearly 80% of global data center electricity-consumption growth through 2030. (Source: IEA)
- Data centers are projected to account for nearly 50% of U.S. electricity-demand growth through 2030. U.S. data processing could consume more electricity than the production of aluminum, steel, cement, chemicals, and other energy-intensive goods combined. (Source: IEA)
- Coal currently supplies approximately 30% of the electricity physically consumed by data centers worldwide. Renewables provide 27%, natural gas supplies 26%, and nuclear energy contributes 15%. Renewables are expected to meet nearly 50% of additional data center electricity demand through 2030. (Source: IEA)
- U.S. data centers currently consume an estimated 17 billion to 19 billion gallons of water per year. Annual consumption could reach 60 billion to 110 billion gallons by 2030. (Source: Water Foundation)
- Approximately 67% of new U.S. data center construction since 2022 has occurred in areas already facing high water stress. (Source: Water Foundation)
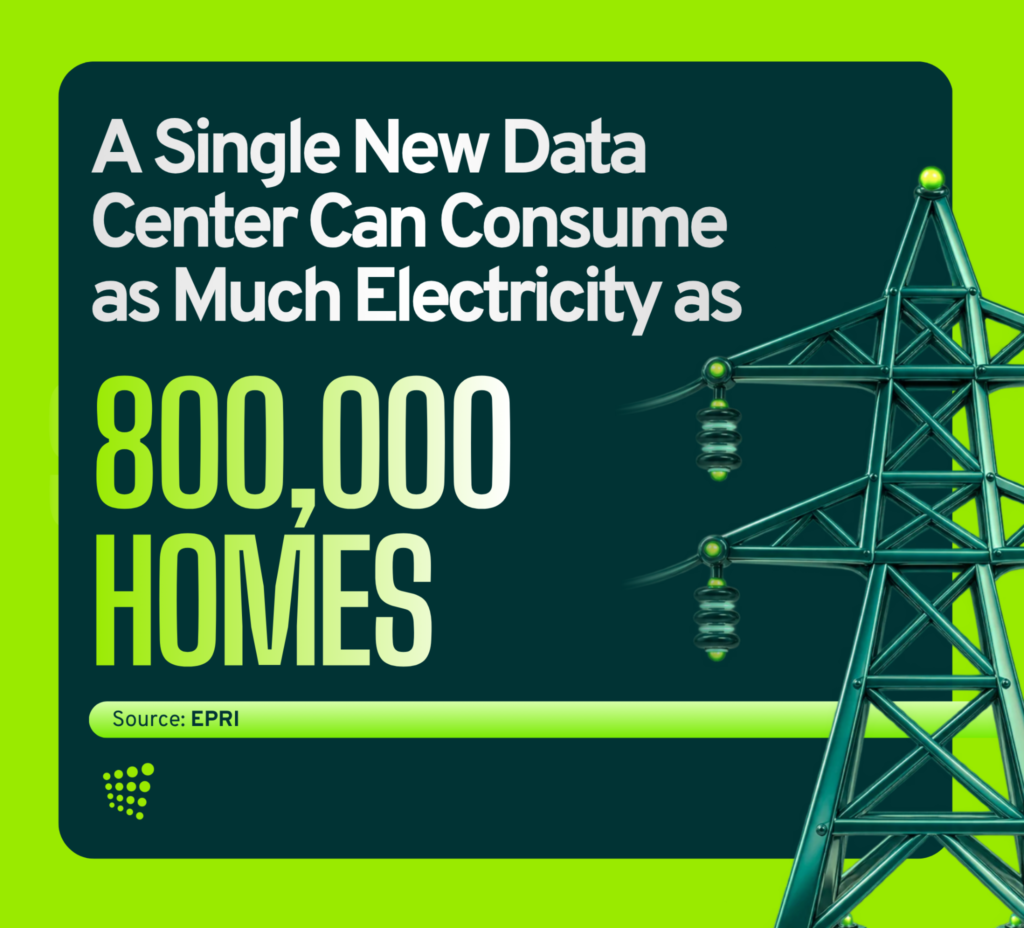
- A new data center can require 100 to 1,000 MW of electricity, roughly equal to the power demand of 80,000 to 800,000 average homes. (Source: EPRI)
- Data centers account for approximately 0.5% of global fuel-combustion CO₂ emissions. Their share could rise to around 1% by 2030. (Source: IEA)
- CO₂ emissions associated with data center electricity use could rise from approximately 180 million tonnestoday to around 320 million tonnes by 2030. Under a high-growth scenario, emissions could approach 500 million tonnes by 2035. (Source: IEA)
- AI-focused data centers consumed approximately 155 TWh of electricity in 2025, equal to about 0.49% of global electricity generation. Total worldwide electricity generation was approximately 31,800 TWh that year. (Source: Our World in Data)
- Average server rack density remained below 8 kW in the 2024 global data center survey, and most facilities did not operate racks above 30 kW. (Source: Uptime Institute)
Data Center Reliability and Outage Statistics
- 50% of data center operators experienced an impactful outage during the previous three years in the 2025 survey, down from 74% in 2020. (Source: Uptime Institute)
- Power accounted for 45% of the most recent impactful data center outages in 2025, down from 54% in 2024. (Source: Uptime Institute)
- End-to-end IT service outages have these main causes:
- Networking and Connectivity: 23%
- Power Failures: 21%
- IT Systems and Software: 18%
- Cooling Failures: 10%
- Third-Party IT Services: 8%
- No IT Service Outage in the Previous Three Years: 19% (Source: Uptime Institute)
- Major third-party IT service provider outages have these main causes:
- Software or Configuration Errors: 54%
- Networking and Connectivity Issues: 46%
- Overload or Capacity Problems: 31%
- Mechanical or Electrical Failures: 22%
- Malicious Cyberattacks: 12% (Source: Uptime Institute)
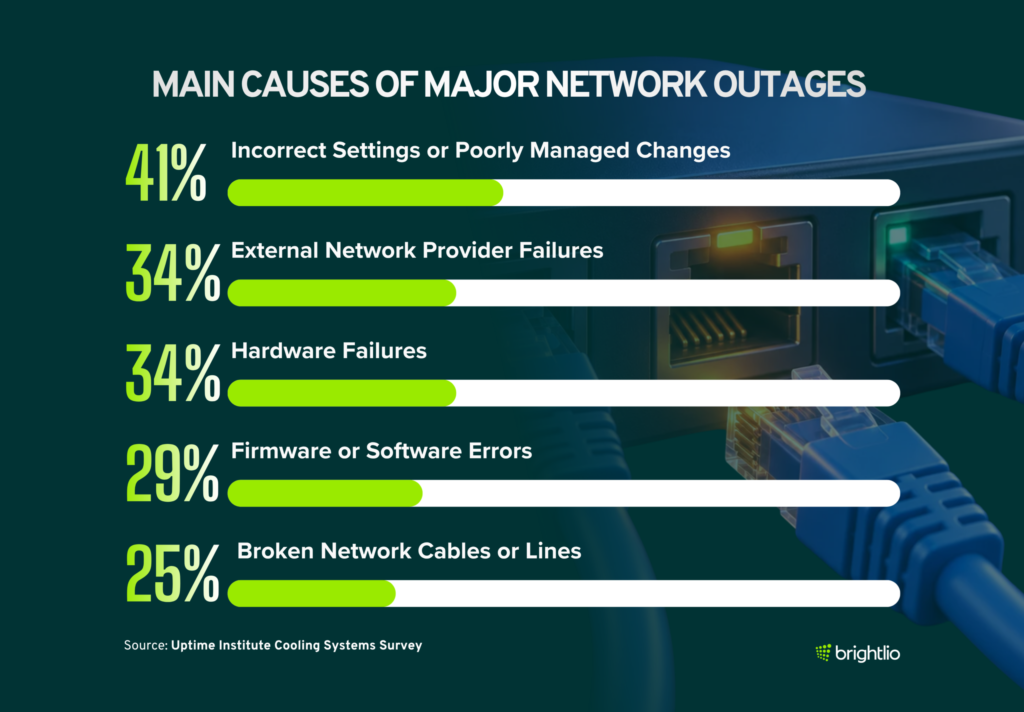
- Major network-related outages have these main causes:
- Configuration and Change-Management Failures: 41%
- Third-Party Network Provider Failures: 34%
- Hardware Failures: 34%
- Firmware and Software Errors: 29%
- Line Breakages: 25%
- Network Congestion: 14%
- Malicious Cyberattacks: 9%
- Corrupted Firewall or Routing Rules: 8%
- Weather Incidents: 5% (Source: Uptime Institute)
- Major IT system and software outages have these main causes:
- Firmware and Software Faults: 53%
- Configuration and Change-Management Issues: 51%
- Hardware Failures: 38%
- Capacity or Congestion Issues: 19%
- Data Synchronization or Corruption: 15%
- Cybersecurity Incidents: 15% (Source: Uptime Institute)
- Human error contributed to 92% of significant, serious, or severe outages, with these levels of involvement:
- Major Contributor: 31%
- Moderate Contributor: 31%
- Minor Contributor: 30%
- Not a Contributor: 8% (Source: Uptime Institute)
- Most of the operators that experienced an impactful outage said the incident was preventable through better management, processes, or configuration, up 7 percentage points from 2024. (Source: Uptime Institute)
- 55% of publicly reported outages were resolved within 12 hours. The share of incidents lasting longer than 48 hours increased for the second consecutive year, with external fiber and subsea cable failures contributing to longer recovery times. (Source: Uptime Institute)
- Operators cited these measures as delivering the strongest resiliency improvements during the previous three years:
- Monitoring and Analytics: 53%
- Electrical Infrastructure Upgrades: 49%
- Training and Staffing: 47%
- Process Improvements: 47%
- Cooling Upgrades: 42%
- Automation and Controls: 36% (Source: Uptime Institute)
- Data center resiliency risk assessments cover these areas across organizations:
- Operations: 83%
- Electrical Infrastructure: 80%
- Physical Security: 75%
- Mechanical Infrastructure: 69%
- Cybersecurity: 66%
- Connectivity: 65%
- Fuel Supplies: 65%
- Climate Risk: 55%
- Systemic Third-Party Risk: 39% (Source: Uptime Institute)
Data Center Workforce and Skills Statistics
- Hiring new staff ranked among the greatest organizational challenges for 37% of data center respondents, while 23% identified staff retention as a leading challenge. (Source: Uptime Institute)
- Enterprise and colocation operators recruited new data center employees from these educational institutions:
- Universities: 47% of Enterprise Operators and 48% of Colocation Operators
- High Schools and Secondary Schools: 14% of Enterprise Operators and 25% of Colocation Operators
- Trade Schools: 15% of Enterprise Operators and 7% of Colocation Operators (Source: Uptime Institute)
- Formal employee mentoring programs were in place at 45% of enterprise data center operators and 51% of colocation operators in 2025. (Source: Uptime Institute)
- Enterprise and colocation data centers cited these roles as having the highest staff turnover:
- Junior and Mid-Level Operations Staff: 27% of Enterprise Data Centers and 44% of Colocation Data Centers
- Operations Management: 16% of Enterprise Data Centers and 15% of Colocation Data Centers (Source: Uptime Institute)
- Enterprise and colocation respondents cited these typical tenures for departing employees:
- More Than Three Years: 72% of Enterprise Respondents and 51% of Colocation Respondents
- Less Than One Year: 7% of Enterprise Respondents and 9% of Colocation Respondents (Source: Uptime Institute)
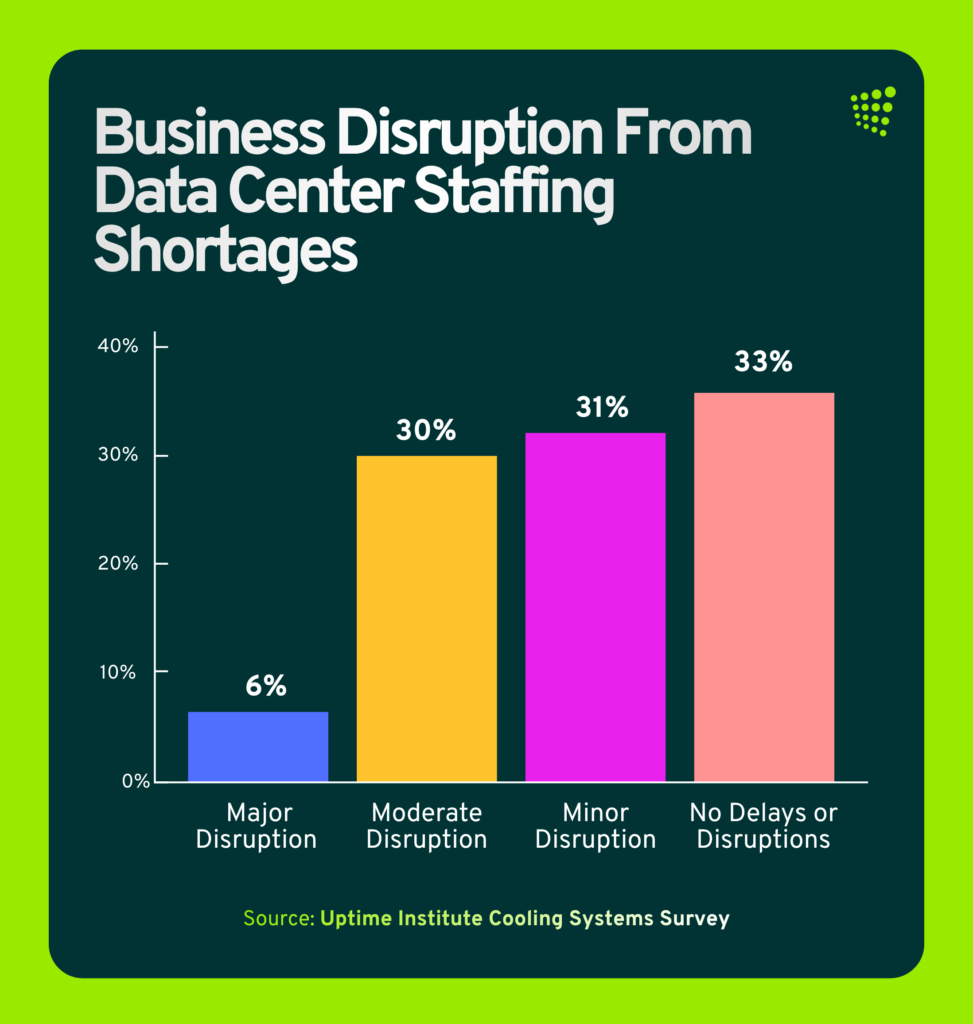
- Staffing shortages at customer data centers caused these levels of business disruption:
- Major Disruption: 6%
- Moderate Disruption: 30%
- Minor Disruption: 31%
- No Delays or Disruptions: 33% (Source: Uptime Institute)
Data Center Statistics by Region
Not all data centers are the same, and regional resource differences can significantly impact statistics.
Here is the regional breakdown:
Africa Data Center Statistics
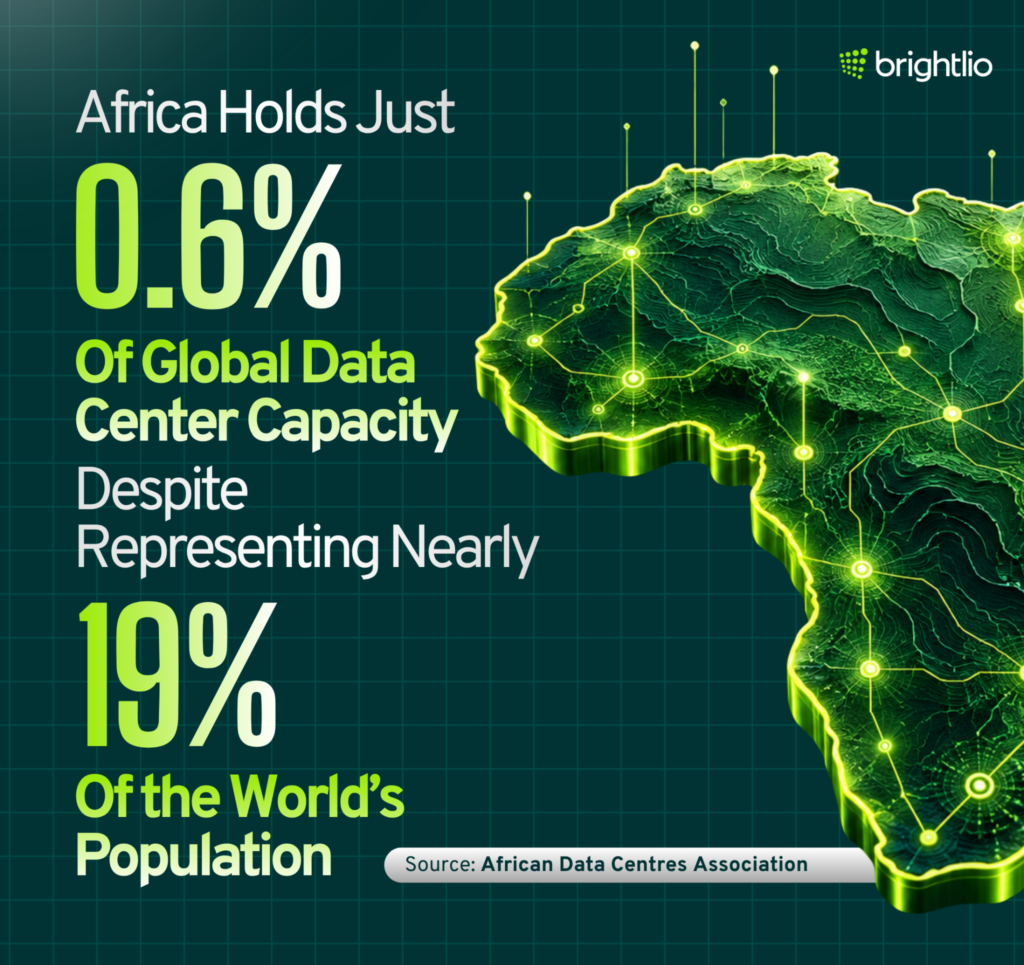
- Africa accounts for only 0.6% of global data center capacity despite representing almost 19% of the world’s population. (Source: African Actors of Data Center Association)
- Africa has approximately 360 MW of active data center capacity, with another 238 MW under construction and 656 MW planned. (Source: African Actors of Data Center Association)
- Africa’s data center capacity is projected to triple to approximately 1.2 GW of total IT load by 2030. (Source: African Actors of Data Center Association)
- Data center utilization remains significantly lower outside South Africa. Live IT capacity in other African markets represents only about one-third of total built market potential, while roughly 74% of South Africa’s market capacity is fully fitted out and utilized. (Source: African Actors of Data Center Association)
- Africa has an internet usage gap of approximately 64%, limiting local digital demand and the utilization of data center infrastructure in many markets. (Source: African Actors of Data Center Association)
- More than 40 African countries have enacted data-protection laws, increasing demand for domestic hosting, data sovereignty, and local digital infrastructure. (Source: African Actors of Data Center Association)
- Africa has approximately 261 data centers across 43 countries. (Source: Data Center Map)
- South Africa leads the continent with 63 data centers, followed by Nigeria with 29, Kenya with 19, Morocco with 15, and Tanzania with 11. (Source: Data Center Map)
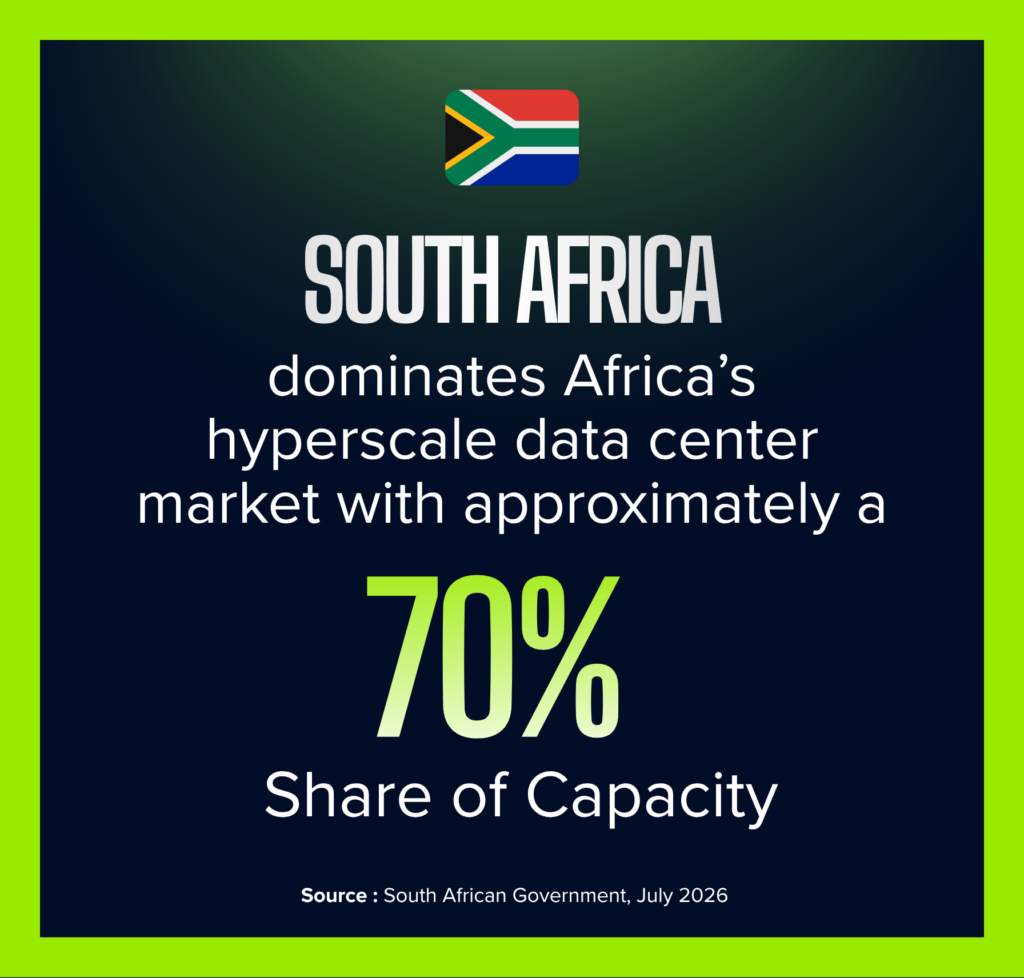
- South Africa hosts approximately 70% of Africa’s data center capacity, making it the continent’s dominant infrastructure hub. (Source: Associated Press)
- Johannesburg has 36 data centers, followed by Cape Town with 13, Durban with 7, and Pretoria with 4. (Source: Data Center Map)
- Africa’s data center market is valued at approximately $2.22 billion in 2026 and is projected to reach $4.36 billion by 2031, representing a 14.46% CAGR. (Source: Mordor Intelligence)
- More than 60 new data centers were built across Africa over the five years through 2024, representing approximately $2.3 billion in combined investment. (Source: Xalam Analytics)
- Developing a 1 MW data center in Africa costs around $10 million per MW on average and can reach approximately $15 million per MW in markets such as Nigeria. (Source: TechAfrica News)
- Telecom Egypt’s RDH1 provides 2.5 MW of IT load, while RDH2 is designed for approximately 4.6 MW. The first two phases bring the Regional Data Hub to 7.1 MW, with the full four-phase development designed to reach 16.3 MW. (Source: Telecom Egypt)
- IFC committed up to $100 million to support Raxio Group’s expansion across underserved African markets. The broader project covers 10 carrier-neutral data centers with combined capacity of approximately 13.5 MW. (Source: International Finance Corporation)
- Microsoft plans to invest an additional ZAR 5.4 billion in cloud and AI infrastructure in South Africa through the end of 2027, building on ZAR 20.4 billion invested over the previous three years. (Source: Microsoft)
- Visa opened its first African data center in Johannesburg in 2025 as part of a ZAR 1 billion investment in South Africa over three years. (Source: Reuters)
- Two planned Equinix data centers near Cape Town are designed for up to 160 MW of combined capacity. The projects received a key land-use approval in July 2026 but remain planned rather than operational. (Source: Data Center Map)
- Teraco operates approximately 189 MW of critical IT capacity across South Africa, including 70 MW at its Isando campus, 64 MW at Bredell, 53 MW in Cape Town, and 2 MW in Durban. (Source: Teraco)
- Teraco’s completed CT2 expansion increased the facility’s critical IT load to 50 MW, adding 32 MW across eight new data halls. Its closed-loop cooling system requires no ongoing water consumption for cooling. (Source: Teraco)
- NAPAfrica carries more than 6 Tbps of peak traffic across more than 2,300 physically connected ports, with total connected capacity approaching 45 Tbps. (Sources: NAPAfrica; Teraco)
- iXAfrica’s Nairobi One campus is designed for 22.5 MW of IT capacity and can support AI workloads of up to 50 kW per rack. More than 90% of Kenya’s electricity is generated from renewable or clean energy sources. (Source: iXAfrica)
- Microsoft and G42’s proposed Kenyan digital infrastructure initiative is valued at $1 billion. The geothermal-powered data center was originally planned at approximately 100 MW with the potential to scale to 1 GW, but the project has been delayed while its scale, power requirements, and commercial commitments remain under discussion. (Sources: G42; Reuters)
- Wingu Africa secured $60 million to expand data center infrastructure in Djibouti, Ethiopia, and Tanzania. Its two Djibouti facilities provide access to 12 operational submarine cable systems. (Source: Wingu Africa)
- MTN’s Lagos data center opened its first phase with 4.5 MW of capacity and space for 780 racks. A second phase could expand capacity to between 14 MW and 20 MW, with both phases valued at approximately $235 million. (Source: Data Center Dynamics)
- Rack Centre’s LGS2 data center in Lagos provides 12 MW of IT capacity across six data halls and 3,240 square meters of white space. The facility can support rack densities of up to 70 kW. (Source: Rack Centre)
- Kasi Cloud opened the first phase of its planned 100 MW Lagos data center campus in May 2026. The project is valued at approximately $250 million and targets a PUE below 1.6. (Source: Data Center Dynamics)
- Tetracore, Huawei, and Inspirive Technologies plan to develop a 20 MW data center in Nigeria valued at approximately $400 million. The facility is designed to use a dedicated 100 MW onsite natural-gas power plant. (Source: Data Center Dynamics)
- Morocco’s planned Igoudar Numérique green data center campus in Dakhla has a target capacity of 500 MW and is designed to run on renewable energy. (Source: Moroccan Ministry of Digital Transition and Administrative Reform)
Asia Data Center Statistics
- Asia has 1,478 data centers across 26 countries in the current inventory. (Source: Data Center Map)
- China has 376 data centers, followed by India with 305, Japan with 261, South Korea with 105, and Hong Kong with 84. (Source: Data Center Map)
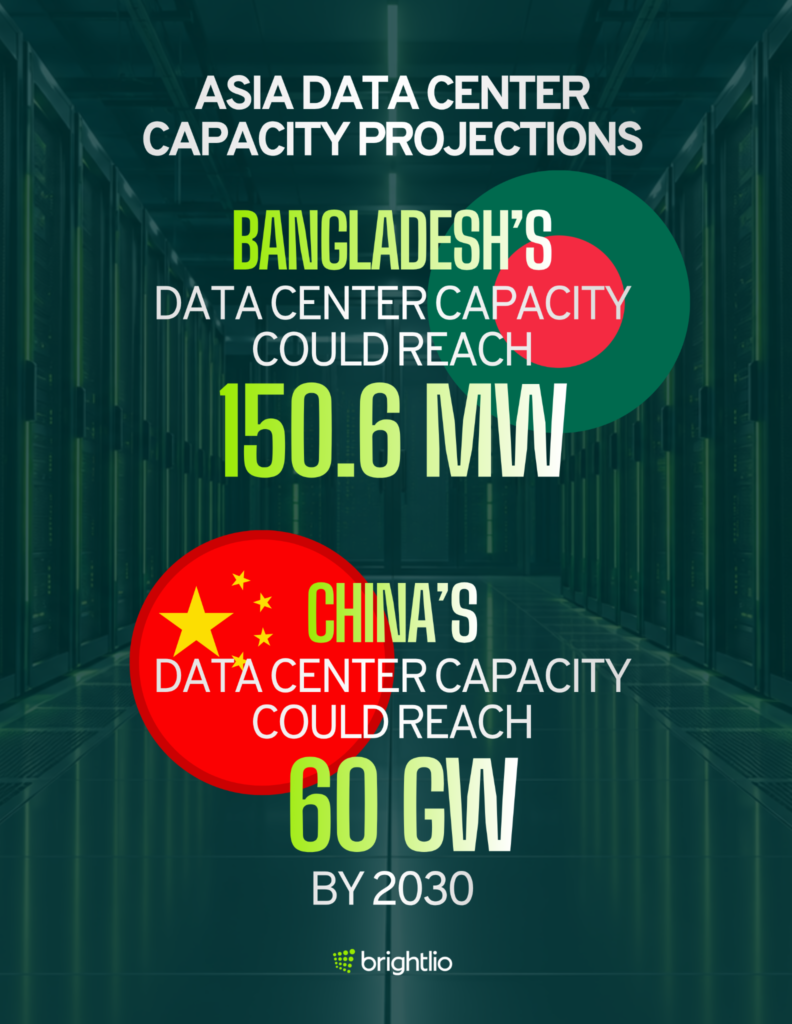
- China had approximately 32 GW of installed data center capacity at the end of 2025. Capacity is projected to reach 40 GW by the end of 2026 and exceed 60 GW by 2030 as another 28 GW of announced projects enters service. (Source: Rystad Energy)
- China’s data center electricity consumption could reach 289 TWh by 2030, representing approximately 2.3% of national electricity demand. Data center power demand is projected to grow at around 19% per year between 2025 and 2030. (Source: Rystad Energy)
- China is preparing a five-year plan worth approximately 2 trillion yuan, or about $295 billion, to develop a nationwide network of interconnected AI computing and data center hubs. The proposal remained under development in June 2026. (Source: Bloomberg)
- India’s live data center IT capacity reached approximately 1.7 GW in 2026 after quadrupling over six years. Another 1.3 GW is under construction, while projects representing 3.2 GW have secured land, power, and permits. (Source: BloombergNEF)
- Maharashtra accounts for approximately 55% of India’s live data center IT capacity and has the country’s largest approved development pipeline. (Source: BloombergNEF)
- Electricity demand from Indian data centers is projected to rise from approximately 11 TWh in 2025 to 91 TWhby 2035, representing more than an eightfold increase. (Source: BloombergNEF)
- Google is investing approximately $15 billion between 2026 and 2030 in its first AI hub in India. The Visakhapatnam project includes a purpose-built data center campus with approximately 1 GW of compute capacity, new energy infrastructure, fiber routes, and an international subsea gateway. (Source: Google)
- Japan’s data center market is projected to almost double within five years and exceed 5 trillion yen, or approximately $32 billion, by 2028. Tokyo and Osaka currently account for around 85% of Japan’s data centers. (Source: Reuters)
- Japan’s AI infrastructure market reached approximately ¥670 billion in 2025 and is moving toward the ¥1 trillion level by 2030. Service providers accounted for 90.6% of AI infrastructure spending in 2025. (Source: IDC)
- Blackstone plans to invest approximately $30 billion in Japanese AI data centers over three to five years and is discussing facilities representing more than 1 GW of combined capacity. (Source: Reuters)
- South Korea plans an initial 550 trillion won investment to develop 8.4 GW of AI data center capacity. The broader national program could expand to approximately 18.4 GW by 2035 and attract more than 1 quadrillion won in total investment. (Source: South Korean Ministry of Trade, Industry and Resources)
- SK Group and AWS are developing an AI data center in Ulsan with approximately 100 MW of capacity. The completed facility is expected to reach about 103 MW and support roughly 60,000 GPUs, with operations beginning in phases from 2027. (Source: SK Group)
- Singapore has more than 70 data centers with total capacity exceeding 1.4 GW. (Source: Singapore Ministry of Digital Development and Information)
- Singapore is making at least another 200 MW of data center capacity available through its second Data Centre Call for Application, with additional capacity possible through new green-energy pathways. (Source: IMDA)
- Singapore’s planned low-carbon data center park on Jurong Island covers approximately 20 hectares and could support up to 700 MW of capacity. (Source: Singapore EDB)
- Data centers currently account for around 7% of Singapore’s electricity consumption, with the share projected to reach approximately 12% by 2030. (Source: IMDA)
- Malaysia approved RM144.4 billion in data center and cloud-computing investments between 2021 and mid-2025. (Source: Malaysian Investment Development Authority)
- Johor has attracted approximately $35 billion in data center investment. Its planned and under-construction capacity could increase more than eightfold from current levels to around 7,000 MW. (Source: Reuters)
- Johor currently has approximately 850 MW of completed data center capacity, another 1,800 MW under construction, and around 2,700 MW in the development pipeline. (Source: JLL)
- AirTrunk is investing approximately $3 billion in two additional Johor data centers with more than 280 MW of combined IT capacity. Its four Malaysian campuses will provide more than 700 MW, bringing its total investment in the country to approximately $6.8 billion. (Source: AirTrunk)
- CoreWeave is developing three AI data centers in Indonesia with 360 MW of contracted IT power. The facilities are scheduled to come online in 2028 and represent the company’s first data center presence in Asia-Pacific. (Source: CoreWeave)
- DayOne secured approximately 450 MW of grid capacity for its Kabil Industrial Tech Park data center campus in Batam, Indonesia. The agreement represents approximately 511 MVA of contracted power capacity. (Source: DayOne)
- Thailand approved seven additional data center and data-hosting projects worth more than $3.1 billion at the first Board of Investment meeting of 2026. The projects include 223 MW across three True IDC facilities, 120 MWacross two GSA facilities, and a 25 MW Stellar DC project. (Source: Thailand Board of Investment)
- Thailand received 36 data center project applications during 2025 representing more than $23.1 billion in proposed investment. (Source: Thailand Board of Investment)
- Vietnam has approximately 41 active data centers with 221 MW of combined designed capacity. A 140 MWViettel hyperscale facility is among the country’s largest projects under development. (Source: U.S. International Trade Administration)
- The VITRO Sta. Rosa data center in the Philippines provides 36 MW of IT load across 18 data halls. The facility offers 12,140 square meters of white space, capacity for up to 4,500 racks, and a dedicated 60 MWsubstation. (Source: VITRO Data Center)
- Hong Kong’s data center market is valued at approximately $4.9 billion in 2026 and is projected to reach $11.64 billion by 2031, representing an 18.89% CAGR. Installed IT load is projected to increase from approximately 1.09 GW to 1.36 GW over the same period. (Source: Mordor Intelligence)
- Taiwan’s installed data center capacity is approximately 302.97 MW in 2026 and is projected to reach 468.11 MW by 2031, representing a 9.09% CAGR. (Source: Mordor Intelligence)
- Bangladesh had approximately 23.55 MW of installed data center IT capacity in 2025. Capacity is projected to reach 150.6 MW by 2030, representing a 44.93% CAGR. Hyperscale colocation currently accounts for approximately 62% of utilized capacity. (Source: Mordor Intelligence)
Australia Data Center Statistics
- Australia has 296 data centers across 33 markets. (Source: Data Center Map)
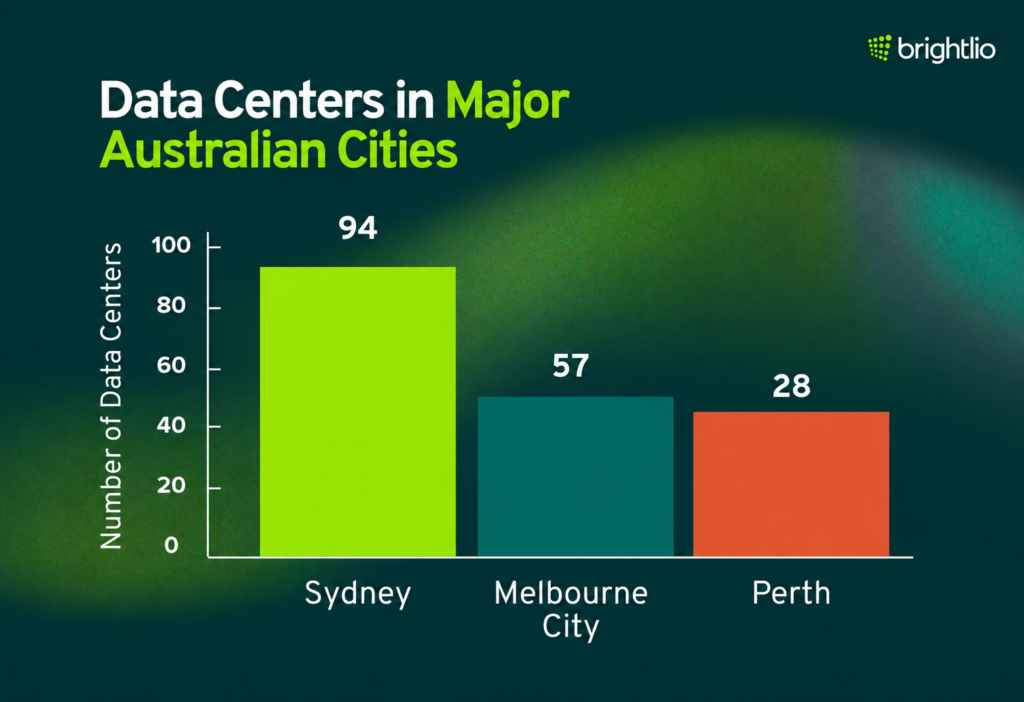
- Sydney leads Australia with 94 data centers, followed by Melbourne with 57, Perth with 28, Brisbane with 24, Adelaide with 19, and Canberra with 18. (Source: Data Center Map)
- Australia’s data center market is valued at approximately US$7.25 billion in 2026 and is projected to reach US$8.92 billion by 2031, representing a 4.25% CAGR. (Source: Mordor Intelligence)
- Colocation accounted for 72.62% of Australia’s data center market in 2025, while Tier III infrastructure represented 83.54%. (Source: Mordor Intelligence)
- Australia’s hyperscale data center market is projected to grow from US$6.27 billion in 2026 to US$16.18 billionby 2031, representing a 20.88% CAGR. (Source: Mordor Intelligence)
- Australia’s AI data center market is valued at approximately US$2.13 billion in 2026 and is projected to reach US$5.22 billion by 2031, representing a 19.65% CAGR. (Source: Mordor Intelligence)
- Australia’s data center construction market is valued at approximately US$11.57 billion in 2026 and is projected to reach US$14.72 billion by 2031, representing a 4.93% CAGR. (Source: Mordor Intelligence)
- Australian data center capacity could increase from approximately 1.35 GW to between 4.7 GW and 7.4 GW by 2035. Operational capacity could reach approximately 2.2 GW to 3.2 GW over the same period as new facilities gradually ramp toward full utilization. (Source: Clean Energy Finance Corporation)
- Data center development through 2035 could require approximately A$85 billion to A$135 billion in construction investment. (Source: Clean Energy Finance Corporation)
- Approximately 50% of Australia’s planned data center capacity is concentrated in Sydney, while Melbourne accounts for around 25%. (Source: Clean Energy Finance Corporation)
- Up to 84% of new Australian data center facilities could support AI workloads, while approximately 65% could be developed as hyperscale sites. (Source: Clean Energy Finance Corporation)
- Sydney had approximately 950 MW of data center inventory in Q1 2026, making it one of the largest data center markets in Asia-Pacific. Vacancy stood at 4.5%, while average asking rents for 250-to-500-kW requirements were approximately US$188 per kW per month. (Source: CBRE)
- Data center availability across the major Asia-Pacific markets fell 43% year over year in Q1 2026 as new capacity was rapidly absorbed by AI and hyperscale demand. (Source: CBRE)
- Data centers consumed approximately 5 TWh of electricity across the National Electricity Market in 2025–26, equal to around 3% of electricity supplied through the grid. (Source: Australian Energy Market Operator)
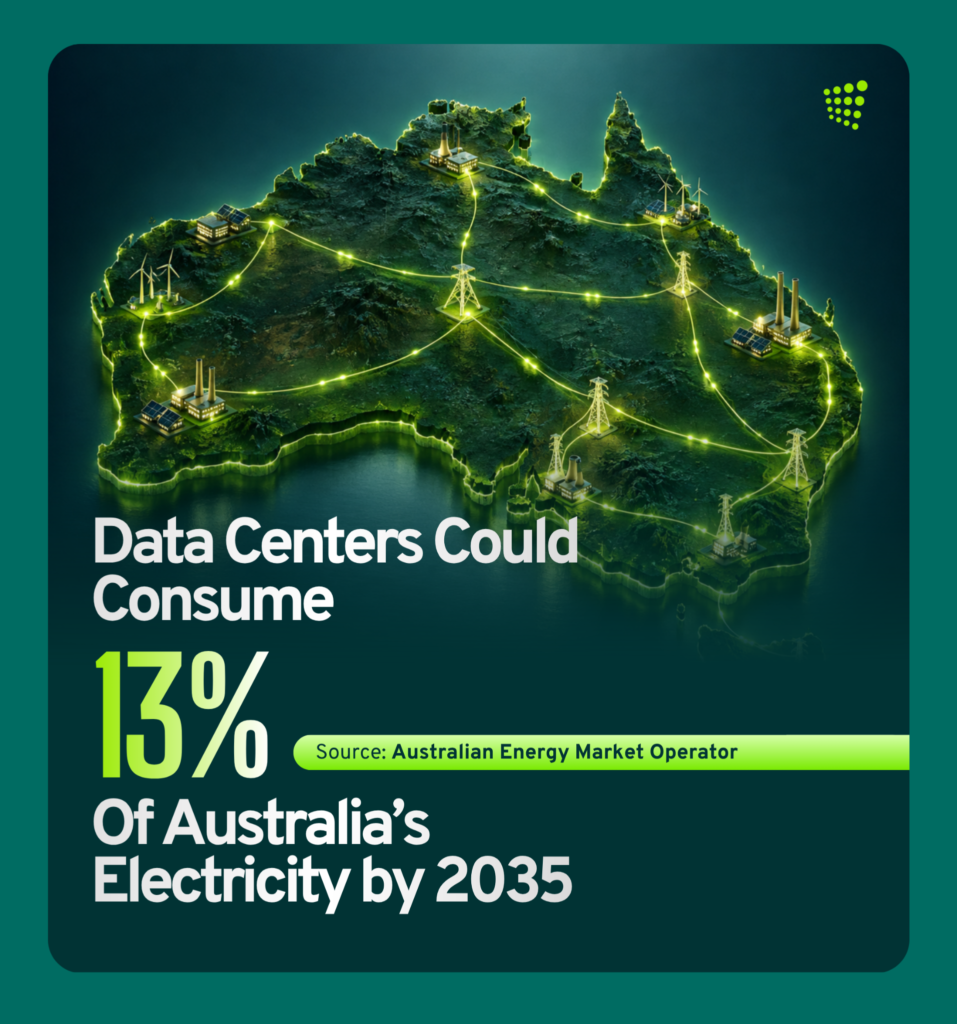
- Data center electricity consumption across the National Electricity Market is projected to increase to approximately 34 TWh by 2035–36, raising its share of grid electricity consumption to around 13%. (Source: Australian Energy Market Operator)
- Average monthly data center electricity demand across the National Electricity Market increased from nearly 200 MW in early 2018 to more than 700 MW by June 2026. New South Wales accounted for approximately 66% of data center electricity consumption and Victoria for 30%. (Source: Australian Energy Market Operator)
- Large data center projects already progressing through the transmission connection process represented 5.4 GWof maximum electricity demand in early 2026. Approximately 60% of that capacity was located in New South Wales and 40% in Victoria. (Source: Australian Energy Market Operator)
- Supporting projected data center growth while limiting electricity-price and emissions impacts could require an additional 3.2 GW of renewable generation and 1.9 GW of battery storage by 2035. (Source: Clean Energy Finance Corporation)
- Without sufficient new renewable generation and storage, data center growth could increase wholesale electricity prices by approximately 26% in New South Wales and 23% in Victoria by 2035. Grid emissions could increase by around 14%, or approximately 6 million tonnes of CO₂ per year. (Source: Clean Energy Finance Corporation)
- Renewable sources supplied 39.5% of Australia’s total electricity generation in 2025, including 19.6% from solar, 14% from wind, and 4.7% from hydro. Renewables represented 42% of electricity generated on Australia’s major grids. (Source: Australian Government)
Europe Data Center Statistics
- Western Europe has 2,983 data centers across 25 countries. (Source: Data Center Map)
- Eastern Europe has 853 data centers across 22 countries. (Source: Data Center Map)
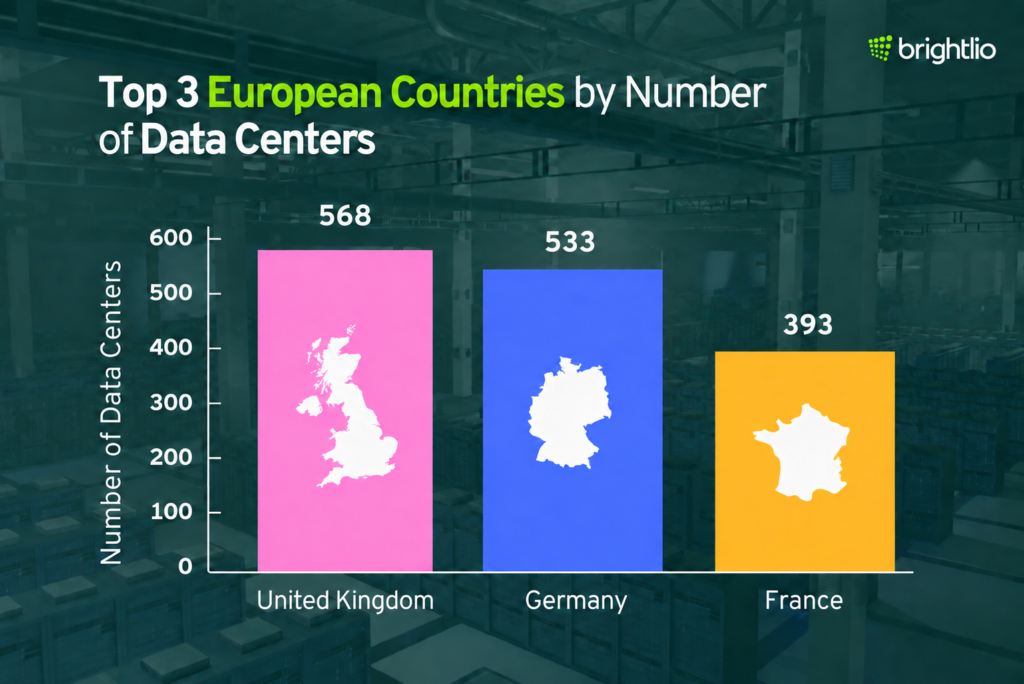
- The United Kingdom leads Europe with 568 data centers, followed by Germany with 533, France with 393, Italy with 262, Spain with 219, the Netherlands with 193, and Russia with 188. (Sources: Data Center Map — Western Europe; Data Center Map — Eastern Europe)
- European data center capacity is projected to reach 13 GW by the end of 2026, representing annual growth of 20%. (Source: CBRE)
- European hyperscaler self-build capacity is projected to grow 22% in 2026, while colocation capacity is projected to increase 18%. (Source: CBRE)
- AI-focused colocation signings increased from 89 MW in the first half of 2025 to 420 MW in the first half of 2026. Approximately 66% of the contracted capacity is scheduled for Nordic markets. (Source: CBRE)
- European colocation IT power is projected to increase from approximately 10.39 GW in 2026 to 23.59 GW by 2031, representing a 17% CAGR. Scale colocation capacity is projected to grow at a 27% CAGR. (Source: European Data Centre Association)
- European data centers could attract approximately €176 billion in cumulative investment between 2026 and 2031. European colocation revenue is projected to reach approximately €57.9 billion by 2031. (Source: European Data Centre Association)
- Southern Europe’s colocation IT capacity is projected to reach approximately 5.85 GW by 2031 as Spain, Italy, Portugal, and other southern markets expand. (Source: European Data Centre Association)
- Frankfurt, London, Amsterdam, Paris, and Dublin had approximately 3.8 GW of live data center capacity in the first half of 2026, up from 1.8 GW in 2019. Another 1.4 GW was under construction and 2 GW was planned. (Source: JLL)
- The five largest European data center hubs delivered 194 MW of new capacity during the first half of 2026 and are on track to deliver approximately 453 MW for the full year. Paris added 72.5 MW, London 49 MW, Frankfurt 45 MW, Amsterdam 16.3 MW, and Dublin 11.4 MW. (Source: JLL)
- Colocation vacancy across Frankfurt, London, Amsterdam, Paris, and Dublin fell to 6.4% in the second quarter of 2026. Frankfurt had the lowest vacancy at 3.1%, followed by Amsterdam at 6.5%, Dublin at 7.2%, London at 7.4%, and Paris at 8%. (Source: JLL)
- Prime powered-land costs across Europe’s largest data center hubs increased 82% between 2021 and 2026, rising from approximately €1.24 million per MW to €2.26 million per MW. Primary-market land costs approximately 2.3 times more than secondary-market land and four times more than tertiary-market land. (Source: JLL)
- Greenfield sites increased from 8% of the European development pipeline in earlier years to 39% of projects scheduled between 2026 and 2028. Planned hyperscale facilities are now located an average of 175 kilometersfrom major hubs, compared with 46 kilometers for projects planned between 2022 and 2025. (Source: JLL)
- European data center electricity consumption is projected to increase by more than 45 TWh, or approximately 70%, between 2024 and 2030. Data centers could account for around 10% of total European Union electricity-demand growth through 2030. (Source: IEA)
- Renewables and nuclear energy are projected to supply approximately 85% of the electricity consumed by European data centers by 2030. (Source: IEA)
- European Union data centers with at least 500 kW of installed IT power are required to report energy consumption, water use, renewable energy, waste heat, and other sustainability metrics. The first reporting cycle received submissions from approximately 770 facilities, representing around 36% of eligible data centers. (Sources: European Commission; EUR-Lex)
- European Union data center capacity is targeted to at least triple within the next 5 to 7 years, with sufficient computing capacity planned to meet EU business and public-sector demand by 2035. The proposed framework targets data center permitting timelines of less than 18 months. (Source: European Commission)
- Up to seven AI gigafactories are planned across the European Union, backed by more than €30 billion in public and private investment. Each facility is designed to contain more than 100,000 advanced AI processors. (Source: European Commission)
- Germany’s installed data center capacity reached approximately 2.98 GW in 2025 and is projected to exceed 5 GW by 2030. (Source: Bitkom)
- AI-focused data center capacity in Germany is projected to increase from approximately 530 MW to 2.02 GWby 2030. AI’s share of national data center capacity could rise from approximately 15% to 40%. (Source: Bitkom)
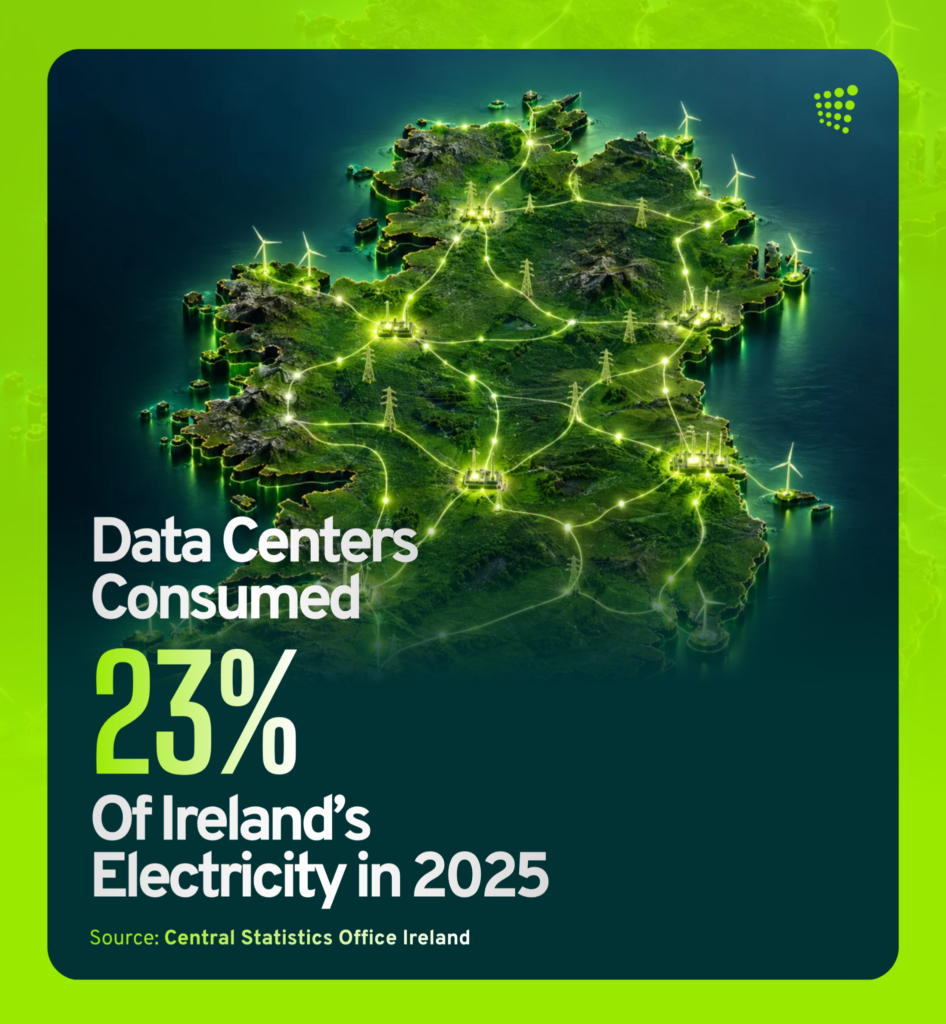
- Irish data centers consumed 7,663 GWh of electricity in 2025, accounting for 23% of the country’s metered electricity consumption. Electricity consumption increased 10% in one year, while the sector’s share of national consumption has risen from 5% in 2015. (Source: Central Statistics Office Ireland)
- Spain had approximately 439 MW of installed commercial data center IT capacity at the end of 2025, up 24%from the previous year. Capacity could reach approximately 2.54 GW by 2030. (Source: SpainDC)
- Data center development in Spain could attract approximately €66.9 billion in direct and indirect investment through 2030, while its annual economic contribution could reach €7.3 billion and support more than 16,000 jobs. (Source: SpainDC)
- Italy has a secured data center development pipeline exceeding 1.2 GW, while total planned capacity exceeds 2.4 GW. Data center land transactions reached approximately €289 million in the first quarter of 2026. (Source: Colliers)
- Central and Eastern European colocation capacity is projected to reach approximately 883 MW in 2026. Poland’s capacity is projected to increase from 197 MW in 2024 to 511 MW by 2031. (Source: European Data Centre Association)
North America Data Center Statistics
U.S. Data Center Market Statistics
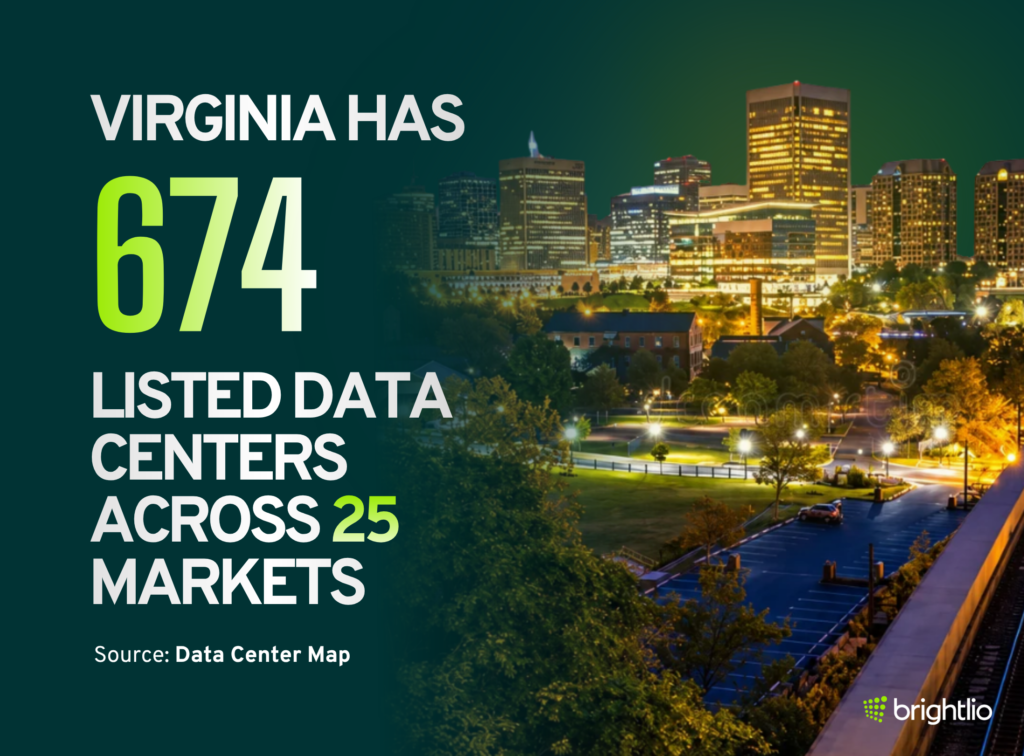
- The United States has 4,767 data centers across all 50 states. Virginia leads with 674, followed by Texas with 537, California with 296, Georgia with 276, Illinois with 242, and Ohio with 240. (Source: Data Center Map)
- The U.S. data center market is valued at approximately US$122.08 billion in 2026 and is projected to reach US$168.34 billion by 2031, representing a 6.64% CAGR. (Source: Mordor Intelligence)
- Installed U.S. data center capacity is projected to increase from 57.08 GW in 2025 to 109.56 GW by 2030, representing a 13.93% CAGR. (Source: Mordor Intelligence)
- Colocation accounted for 56.48% of the U.S. data center market in 2025, while Tier III facilities represented 68.12% of the market. (Source: Mordor Intelligence)
- Primary U.S. data center market supply reached a record 10,903 MW in the first half of 2026, representing year-over-year growth of 33.7%. (Source: CBRE)
- Vacancy across primary U.S. data center markets fell to a record 1.4% in the first half of 2026 despite the rapid increase in new supply. (Source: CBRE)
- Net absorption across primary markets reached 1,456.2 MW in the first half of 2026, up 11.7% year over year. (Source: CBRE)
- Data center capacity under construction across primary markets reached a record 7,481.1 MW in the first half of 2026, representing year-over-year growth of 24.8%. (Source: CBRE)
- Approximately 80.4% of data center capacity under construction in primary markets was already preleased in the first half of 2026. Less than 1,500 MW remained available, equivalent to roughly six months of demand at the prevailing absorption rate. (Source: CBRE)
- Northern Virginia remained the largest U.S. data center market with 4,496.5 MW of inventory in the first half of 2026. Its vacancy rate fell to just 0.2%, while 2,420.2 MW of additional capacity was under construction. (Source: CBRE)
- Northern Virginia recorded 467.6 MW of net absorption in the first half of 2026, the highest of any primary U.S. market. (Source: CBRE)
- Atlanta had 2,882 MW of data center capacity under construction in the first half of 2026, up 52.3% year over year and surpassing Northern Virginia for the largest construction pipeline among primary markets. (Source: CBRE)
- Average asking rates for 250-to-500-kW requirements across primary markets increased 4.3% in the first half of 2026 and are expected to exceed US$215 per kW per month during the year. (Source: CBRE)
- Asking rates for 3-to-10-MW deployments increased 8.3% in the first half of 2026, while rates for 500-kW-to-3-MW requirements increased 7.9% and rates for deployments above 10 MW increased 6.7%. (Source: CBRE)
- Annual investment volume for operational data centers fell by nearly 50% in 2025 to approximately US$3 billion as power delivery, supply-chain, permitting, and entitlement delays extended transaction timelines. (Source: CBRE)
- Annual single-asset, single-borrower commercial mortgage-backed securities issuance reached a record US$11.2 billion in 2025. Data center transactions accounted for approximately 11% of total issuance. (Source: CBRE)
- At least 36 U.S. states offer targeted incentives for data center development, including sales-tax exemptions, equipment-tax exemptions, and property-tax abatements. (Source: CBRE)
- Data centers are expected to contribute nearly 50% of Loudoun County’s property-tax revenue in 2026. (Source: CBRE)
- Tier IV data center capacity is projected to grow at a 6.83% CAGR through 2031. Tier IV facilities carry a pricing premium of approximately 25% to 40% over Tier III equivalents but deliver substantially greater fault tolerance for mission-critical workloads. (Source: Mordor Intelligence)
U.S. Data Center Power and Construction Statistics
- U.S. private data center construction spending reached a record annualized rate of approximately $75.2 billion in July 2026, up about 57% year over year. (Source: U.S. Census Bureau)
- Data center construction accounted for all of the growth in U.S. nonresidential construction spending in July 2026. Excluding data centers, nonresidential construction spending declined for the second consecutive month. (Source: Associated Builders and Contractors)
- More than 474 GW of large-load connection requests are seeking access to the Texas power grid, more than five times the grid’s record peak electricity demand. (Source: Office of the Texas Governor)
- Approximately 250 to 300 projects, most of them data centers, are undergoing additional review before advancing through the Texas grid-connection process. These projects represent around 200 GW of potential future electricity demand. (Source: Texas Tribune)
- More than 1,800 large-load projects have entered the Texas grid-connection queue in recent years, and approximately 90% are data center projects. (Source: Texas Tribune)
- Approximately 189 GW of proposed U.S. gas-fired generation is intended primarily to supply data centers. (Source: Global Energy Monitor)
- Gas-fired generation already under construction in the United States reached 52 GW in the first half of 2026, including 16.9 GW intended primarily to supply data centers. (Source: Global Energy Monitor)
- Texas has approximately 122 GW of gas-fired generation in development, including around 77 GW intended primarily to power data centers. (Source: Global Energy Monitor)
- Engine-based generation capacity planned specifically for data centers more than tripled within six months to approximately 45 GW, as developers increasingly turned to faster-deploying alternatives to large gas turbines. (Source: Global Energy Monitor)
- Equipment and infrastructure constraints are extending data center ready-for-service timelines. Converting existing air-cooled facilities to liquid cooling can delay delivery by more than six months. (Source: CBRE)
- Opposition to data center development resulted in 142 protests across 42 states in July 2026. Only 14% of Americans would support an AI data center being built in their community, while roughly one-third approve of the current pace of U.S. data center construction. (Source: Reuters)
U.S. AI and Hyperscale Data Center Statistics
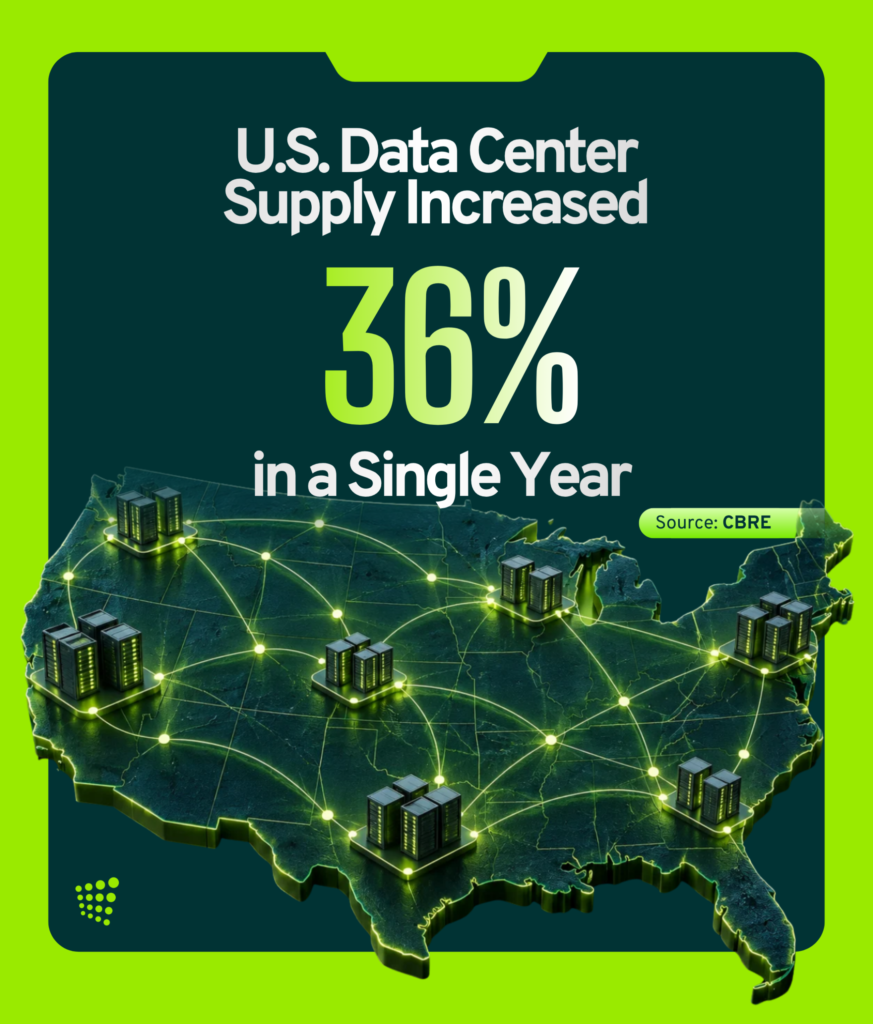
- Stargate has surpassed 10 GW of secured U.S. AI infrastructure capacity, reaching its original capacity target more than two years ahead of schedule. More than 3 GW was added during a 90-day period in early 2026. The program was launched with a commitment to invest $500 billion in U.S. AI infrastructure. (Source: OpenAI)
- Total U.S. data center capacity is projected to double within the next three years, while operational capacity at hyperscaler-owned facilities could double within just two years. (Source: Synergy Research Group)
- Almost half of the nearly 1,500 large data centers in the global development pipeline are located in the United States. The U.S. pipeline represents approximately 45 GW of additional IT capacity across 74 companies. (Source: Synergy Research Group)
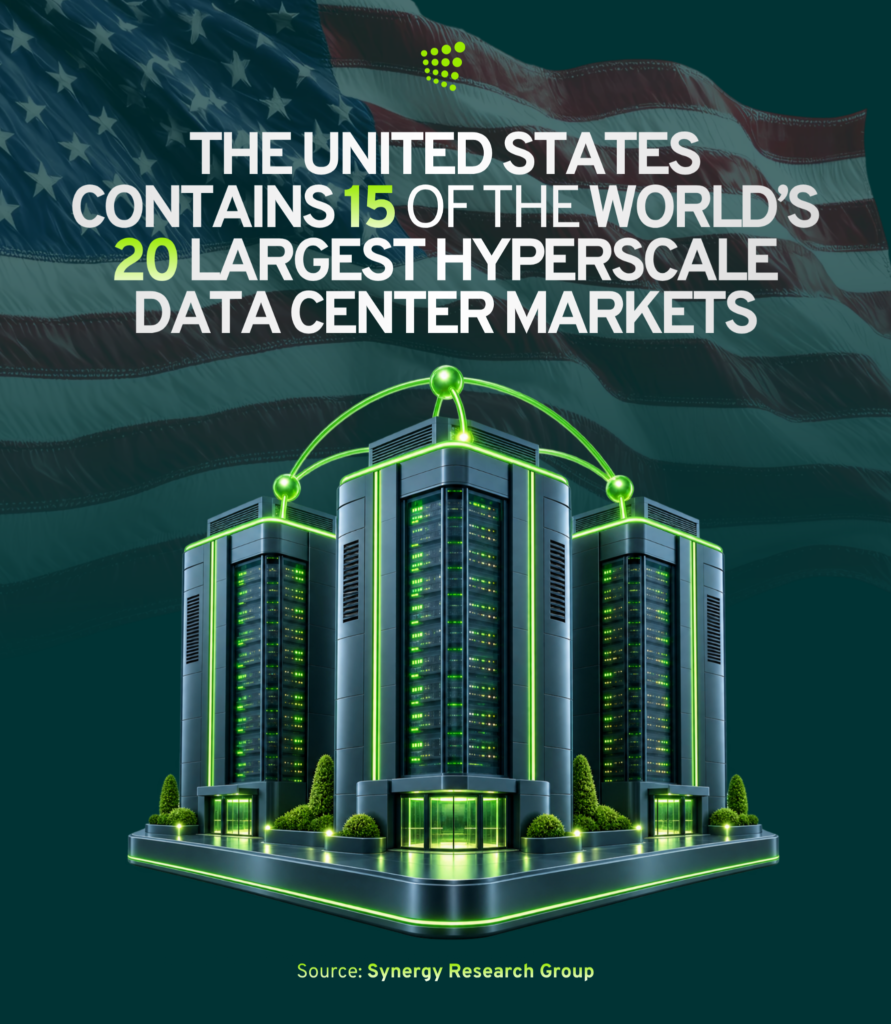
- The United States contains 15 of the world’s 20 largest hyperscale data center markets, while 62% of the world’s hyperscale operators are headquartered in the country. (Source: Synergy Research Group)
- Data center capacity across eight primary U.S. markets increased 36% in 2025, reaching 9,432 megawatts (MW). (Source: CBRE)
- Operational hyperscale data center capacity in Texas increased 71% in one year, compared with worldwide growth of 36%. (Source: Synergy Research Group)
- Texas and the Midwest accounted for approximately 33% of operational U.S. hyperscale data center capacity at the end of 2025 but represent 53% of new capacity scheduled to come online over the next several years. (Source: Synergy Research Group)
- The Richland Parish data center campus in Louisiana is being expanded to 5 GW of AI compute capacity, making it Meta’s largest data center development. Total regional investment exceeds $50 billion, with approximately 7,500 jobs expected at peak construction and 1,000 operational roles once completed. (Source: Meta Data Centers)
- Planned data center investment across Mississippi has reached $25 billion, covering multiple cloud and AI infrastructure campuses and approximately 2,000 full-time data center jobs. (Source: Amazon)
- Planned data center investment in northwest Louisiana has increased to $18 billion across three campuses. The developments are expected to create up to 750 full-time data center jobs, while as much as $400 million will fund local water infrastructure. (Source: Amazon)
- New data center campuses in Northern Indiana represent approximately $15 billion in investment and 2.4 GW of additional data center capacity. The projects are expected to create approximately 1,100 high-skilled jobs. (Source: Amazon)
- Data center and AI infrastructure investment across the PJM electricity region exceeds $25 billion, alongside a $3 billion agreement to modernize two Pennsylvania hydropower facilities. (Source: Google)
- AI data center investment in Wisconsin exceeds $7 billion across two large facilities. The Mount Pleasant campus is designed to house hundreds of thousands of GPUs for frontier AI model training. (Source: Microsoft)
- The MACROHARDRR data center in Southaven, Mississippi, represents an investment exceeding $20 billionand is designed to increase AI computing capacity in the greater Memphis region to nearly 2 GW. (Source: Office of the Governor of Mississippi)
- The Colossus AI supercomputer in Memphis contains 200,000 NVIDIA H100 GPUs in a single interconnected cluster. Its expansion roadmap targets as many as 1 million GPUs. (Source: SpaceXAI)
U.S. Data Centers by State and City
- Illinois hosts over 222 data center facilities thanks to low electricity costs averaging $0.06 per kilowatt-hour and a climate that allows outside-air cooling on approximately 300 days each year.
- Connecticut has 59 data centers. Energy costs are 9.75¢ per kWh through Eversource and 11.68¢ per kWh through United Illuminating.
- Reno has 25 data centers. Energy costs stand at 15¢ per kWh, and average internet speed reaches 109 Mbps with a 10 Gbps maximum.
- Florida has 121 data centers. Energy costs average 17¢ per kWh.
- Utah has 43 data centers, mostly in Salt Lake City and Orem. Energy costs average 8.41¢ per kWh.
- Iowa hosts 100 data centers, mainly in Des Moines and Council Bluffs. Energy costs are 8.65¢ per kWh.
- Ohio hosts 179 data centers, with over 100 in Central Ohio, including sites for Amazon, Meta, and Google. Energy costs are 10.68¢ per kWh.
- Maryland hosts 44 data centers, mainly in Baltimore and Frederick. Energy costs are 13.55¢ per kWh.
- New Jersey hosts 76 data centers, with major hubs in Piscataway, Secaucus, and Newark. Energy costs are 14.76¢ per kWh.
- Southern California hosts 80 data centers, mostly in Los Angeles and San Diego. Energy costs are 23.13¢ per kWh.
- New York hosts 140 data centers, mainly in New York City, Buffalo, and Albany. Energy costs are 15.28¢ per kWh.
- Oregon hosts 131 data centers, mostly in Portland, Eugene, and Bend. Energy costs are 10.58¢ per kWh.
- Texas hosts 350 data centers, with major hubs in Dallas, Houston, and San Antonio. Energy costs are 7.18¢ per kWh.
- Virginia has 674 data centers across 25 markets, according to Data Center Map
- Northern Virginia hosts over 300 data centers, mostly in Ashburn, known as “Data Center Alley.” Energy costs are 9.25¢ per kWh.
- Georgia hosts 148 data centers, with most located in Atlanta. Energy costs are 9.94¢ per kWh.
- Arkansas hosts 5 data centers, mainly in Little Rock and West Memphis. Energy costs are 10.11¢ per kWh.
- Kansas City hosts 12 data centers. Energy costs are 9.45¢ per kWh.
- Indianapolis hosts 30 data centers. Energy costs are 12.31¢ per kWh.
- Cincinnati hosts 21 data centers. Energy costs are 10.68¢ per kWh.
- Pittsburgh hosts about 35 data centers, representing 42% of Pennsylvania’s total. Energy costs are 12.14¢ per kWh.
- Milwaukee hosts 20 data centers. Energy costs are 11.76¢ per kWh.
- Cleveland hosts 24 data centers, with operators including H5 Data Centers, Expedient, DataBank, and BlueBridge Networks. Energy costs are 10.68¢ per kWh.
- Detroit has 42 data centers. Commercial electricity in Michigan costs 19.17¢ per kWh.
- Minneapolis has 52 data centers. The commercial electricity rate is 10.98¢ per kWh.
- Massachusetts has 50 data centers across 10 markets, with 31 in Boston. Electricity costs 22.46¢ per kWh.
- Las Vegas hosts 32 data centers. The commercial electricity rate in Nevada is 9.85¢ per kWh.
- Albuquerque is home to 17 data centers and serves as New Mexico’s main hub. Commercial electricity costs average 9.69¢ per kWh.
- Charlotte hosts 83 data centers across 14 markets in North Carolina. The commercial electricity rate averages 10.92¢ per kWh.
- Raleigh hosts 24 data centers. The commercial electricity rate is 10.92¢ per kWh.
- Jacksonville hosts 17 data centers. The commercial electricity rate is 12.03¢ per kWh.
- Philadelphia hosts 88 data centers across 12 markets. The commercial electricity rate is 12.14¢ per kWh.
- Nashville hosts 27 data centers, leading the market in Tennessee. The commercial electricity rate is 11.46¢ per kWh.
- Salt Lake City hosts 29 data centers, contributing to Utah’s 43 total across six markets. The commercial electricity rate is 7.77¢ per kWh.
- Colorado hosts 55 data centers across four markets, with most located in Denver. The commercial electricity rate is 11.12¢ per kWh.
- Houston hosts 32 data centers. The commercial electricity rate is 7.43¢ per kWh.
- Atlanta anchors Georgia’s data center market and holds most of the state’s facilities. The commercial electricity rate is 11.49¢ per kWh.
- Phoenix hosts 130 data centers, with commercial electricity rates averaging 11.92¢ per kWh.
- South Carolina hosts over 35 data centers, backed by low-cost power, expanding fiber and subsea connectivity, and major investments from Google, Meta, and DC BLOX.
- Maine hosts 7 data centers, supported by 5.25 GW of grid capacity and commercial electricity at 20.63¢ per kWh.
- Kentucky has 28 data centers operated by 15 providers, anchored by a 150 MW Core Scientific campus and a planned 402 MW, 1.8 million ft² hyperscale project in Louisville.
Canada Data Center Statistics
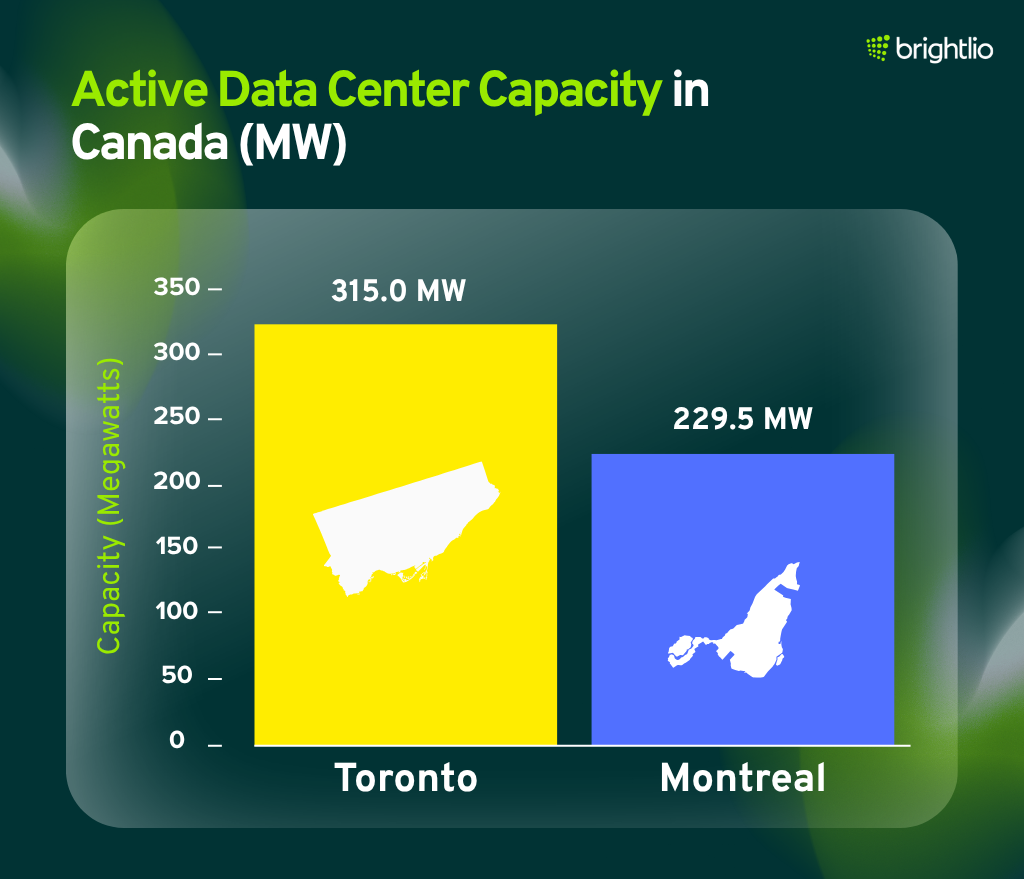
- Canada has 292 data centers across 39 markets. Toronto leads with 68, followed by Montreal with 54, Vancouver with 31, Calgary with 20, and Edmonton with 17. (Source: Data Center Map)
- Canada’s data center market is valued at approximately US$13.06 billion in 2026 and is projected to reach US$25.09 billion by 2031, representing a 13.95% CAGR. (Source: Mordor Intelligence)
- Installed data center IT capacity is projected to increase from 3.13 GW in 2025 to 3.97 GW by 2030. (Source: Mordor Intelligence)
- Colocation accounted for 90.72% of Canada’s data center market in 2025, while Tier III facilities represented 80.95%. (Source: Mordor Intelligence)
- Large data centers accounted for approximately 33.72% of installed capacity in 2025, representing more than 1.1 GW of IT load. (Source: Mordor Intelligence)
- IT and telecommunications accounted for 48.12% of Canada’s data center market in 2025, while Quebec represented 24.55% of the national market. (Source: Mordor Intelligence)
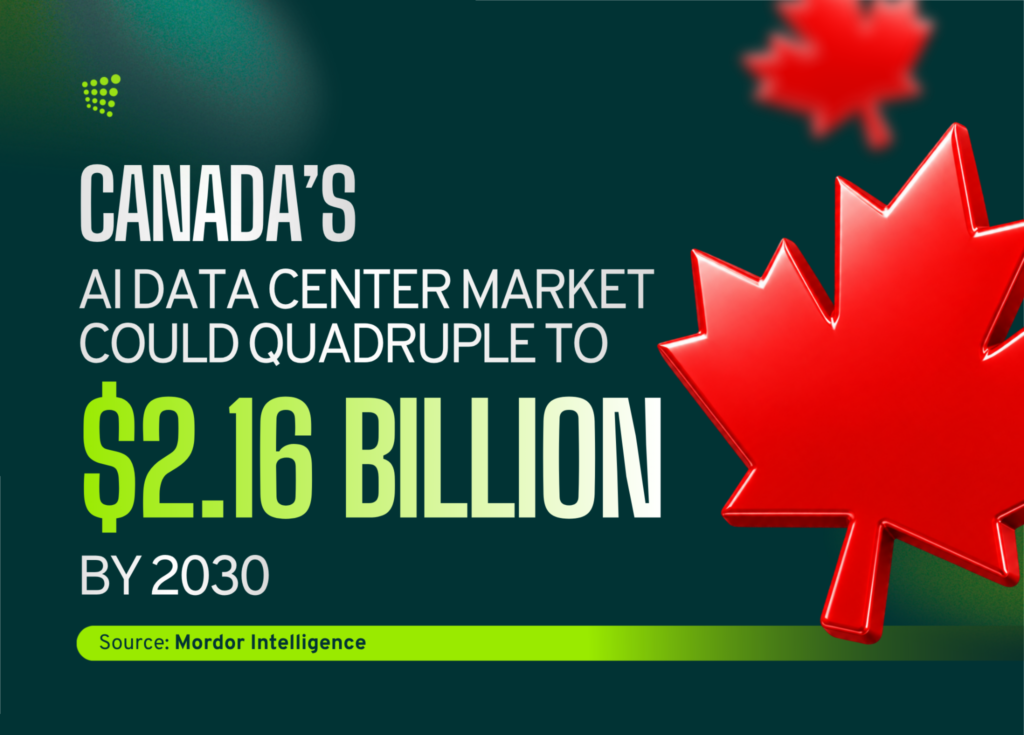
- Canada’s AI data center market is projected to increase from US$500 million in 2025 to US$2.16 billion by 2030, representing a 33.91% CAGR. (Source: Mordor Intelligence)
- Canada’s hyperscale data center market is valued at approximately US$3.77 billion in 2026 and is projected to reach US$10.21 billion by 2031, representing a 22.07% CAGR. (Source: Mordor Intelligence)
- Hyperscale self-build facilities accounted for 62.16% of the Canadian hyperscale market in 2025, while hyperscale colocation is projected to grow at a 23.54% CAGR through 2031. (Source: Mordor Intelligence)
- Canada’s data center construction market is valued at approximately US$3.71 billion in 2026 and is projected to reach US$6.27 billion by 2031, representing an 11.05% CAGR. (Source: Mordor Intelligence)
- Alberta, Ontario, and Quebec account for approximately 85% of Canada’s live and under-construction data center IT capacity. (Source: Rabobank)
- Canada generated 625.2 million MWh of electricity in 2025. Hydroelectricity supplied 54.9%, nuclear energy supplied 13%, and wind and solar supplied a combined 9%. (Source: Statistics Canada)
- Canadian data center electricity demand is projected to increase from approximately 3 TWh in 2025 to 11 TWhby 2030 and 16 TWh by 2035. (Source: Environment and Climate Change Canada)
- Baseline energy scenarios include an additional 1.5 GW of Canadian data center load by 2030 and 3.5 GW by 2050. A higher-growth scenario raises potential data center load to 2.7 GW by 2030 and 12 GW by 2050. (Source: Canada Energy Regulator)
- British Columbia received 15 applications for AI and data center grid connections representing nearly 800 MWof requested electricity demand. The initial two-year allocation provides up to 300 MW for AI data centers and 100 MW for conventional data centers. (Sources: BC Hydro; Government of British Columbia)
- Quebec data center electricity demand is expected to increase sevenfold to more than 1,000 MW by 2035. New data centers requiring more than 5 MW of capacity are subject to a proposed electricity rate averaging approximately 13¢ per kWh. (Source: Hydro-Québec)
- Alberta has approximately 19,565 MW of new data center load seeking grid connections, compared with the province’s record peak electricity demand of approximately 12,785 MW. The first phase of new large-load grid connections was limited to 1,200 MW. (Source: Government of Alberta)
- Alberta’s largest planned AI data center represents more than C$13 billion in investment and could draw approximately 1.8 GW at full buildout. The campus covers approximately 1,750 acres and 2.9 million square feet. (Source: Government of Alberta)
- Canada’s Sovereign AI Compute Strategy provides up to C$2 billion for domestic AI computing infrastructure, including up to C$700 million for projects that expand Canadian AI data center capacity. (Source: Government of Canada)
Mexico Data Center Statistics
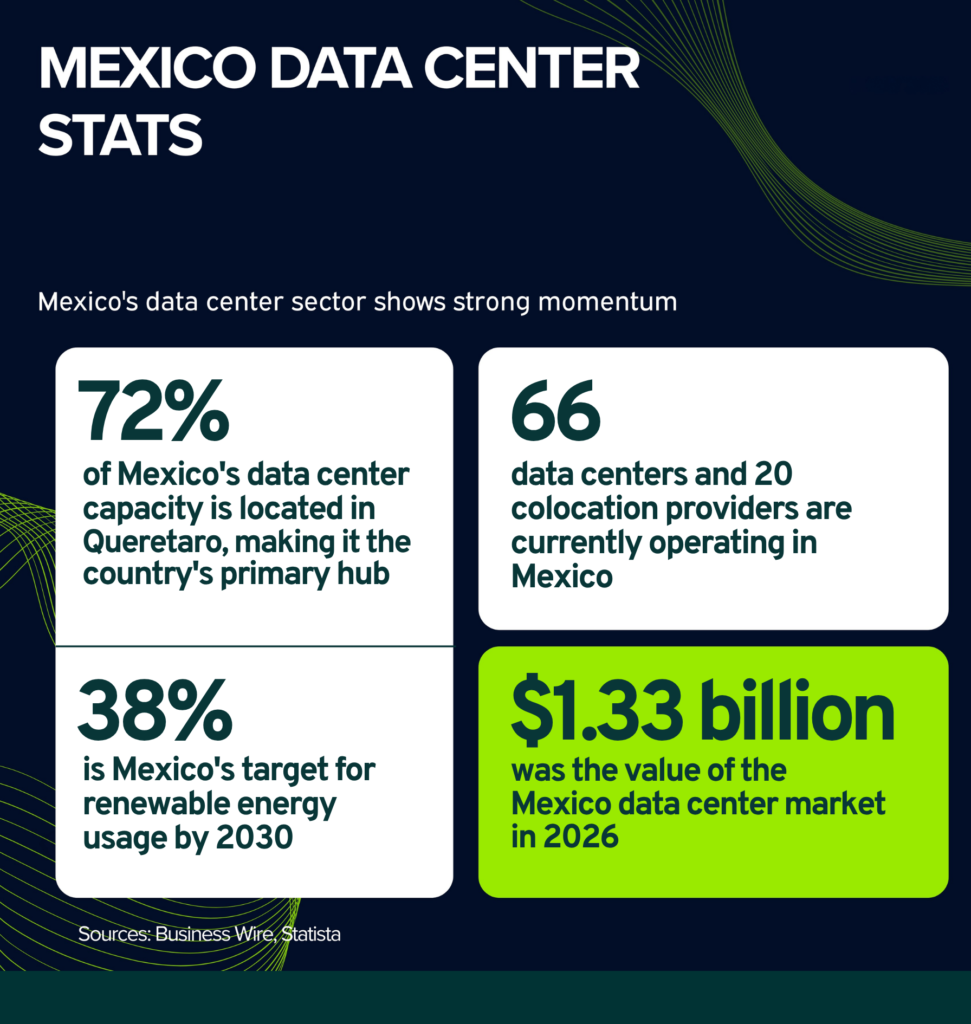
- Mexico has 66 data centers across 15 markets. Querétaro leads with 19, followed by Mexico City with 15, Guadalajara with 8, Monterrey with 7, and Mérida with 5. (Source: Data Center Map)
- Mexico’s data center market is valued at approximately US$1.33 billion in 2026 and is projected to reach US$2.53 billion by 2031, representing a 13.74% CAGR. (Source: Mordor Intelligence)
- Installed data center IT capacity is projected to increase from approximately 530 MW in 2025 to 1.27 GW by 2030, representing a 19.03% CAGR. (Source: Mordor Intelligence)
- Colocation accounted for 83.1% of Mexico’s data center market in 2025, while Tier III facilities represented 83.2%. (Source: Mordor Intelligence)
- IT and telecommunications accounted for 48.02% of Mexico’s data center market in 2025. (Source: Mordor Intelligence)
- Querétaro accounted for approximately 31.1% of Mexico’s data center market revenue in 2025, making it the country’s largest data center hub by market share. (Source: Mordor Intelligence)
- Mexico’s hyperscale data center market is valued at approximately US$440 million in 2026 and is projected to reach US$1.02 billion by 2031, representing an 18.57% CAGR. (Source: Mordor Intelligence)
- Hyperscale self-build facilities accounted for 59.83% of Mexico’s hyperscale market in 2025, while hyperscale colocation is projected to grow at a 19.53% CAGR through 2031. (Source: Mordor Intelligence)
- Mega hyperscale campuses above 60 MW are projected to grow at a 19.46% CAGR through 2031, while facilities between 25 MW and 60 MW accounted for 51.24% of the hyperscale market in 2025. (Source: Mordor Intelligence)
- Mexico’s AI data center market is valued at approximately US$87.19 million in 2026 and is projected to reach US$261.5 million by 2031, representing a 24.55% CAGR. (Source: Mordor Intelligence)
- Mexico’s data center construction market is valued at approximately US$1.50 billion and is projected to reach US$2.30 billion by 2031, representing a 7.36% CAGR. More than 420 MW of additional IT load capacity is expected to be added through the current construction pipeline. (Source: Mordor Intelligence)
- Mexico’s data center power market is valued at approximately US$500.85 million in 2026 and is projected to reach US$696.45 million by 2031, representing a 6.82% CAGR. (Source: Mordor Intelligence)
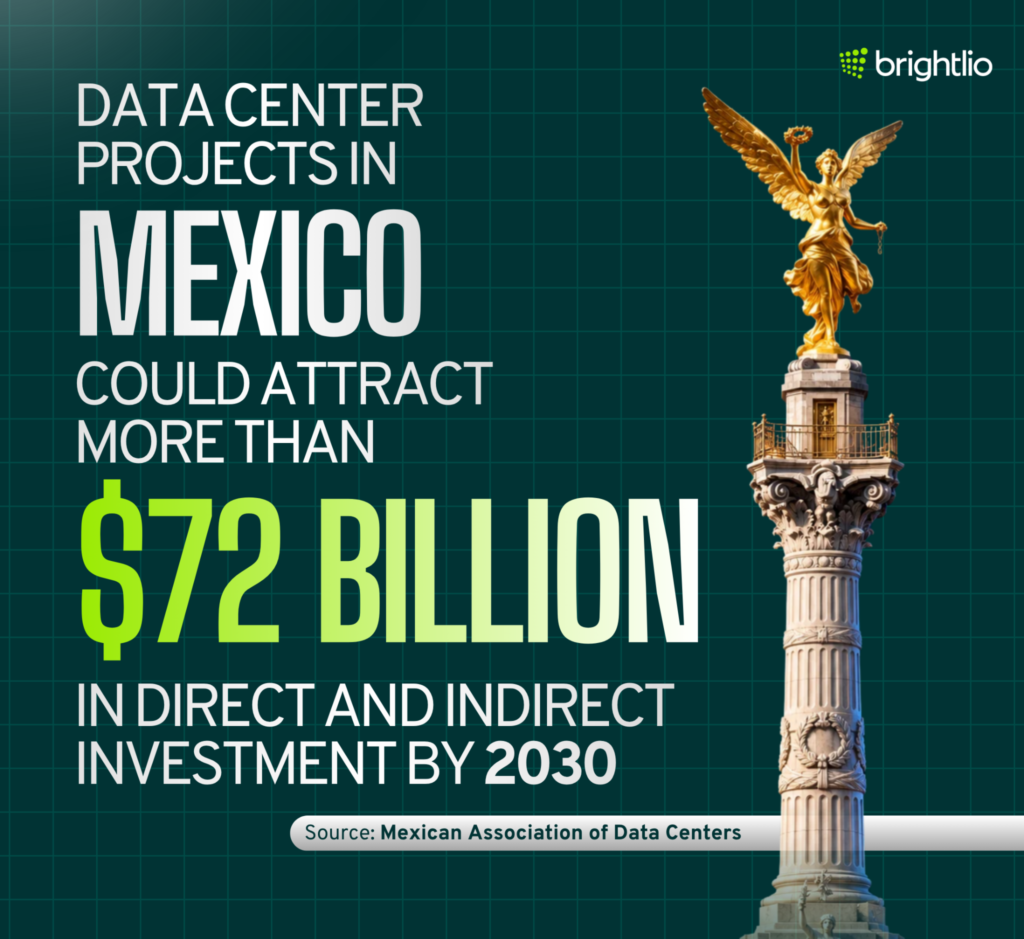
- Mexico’s data center industry is projected to add approximately 1,516 MW of capacity through 2030. The expansion could require more than US$18.1 billion in direct investment and generate more than 20,000 direct jobs and 75,000 indirect jobs. (Source: Mexico Industry / MEXDC)
- The same expansion could generate an estimated US$54.1 billion in total economic impact through 2030. (Source: Mexico Industry / MEXDC)
South America Data Center Statistics
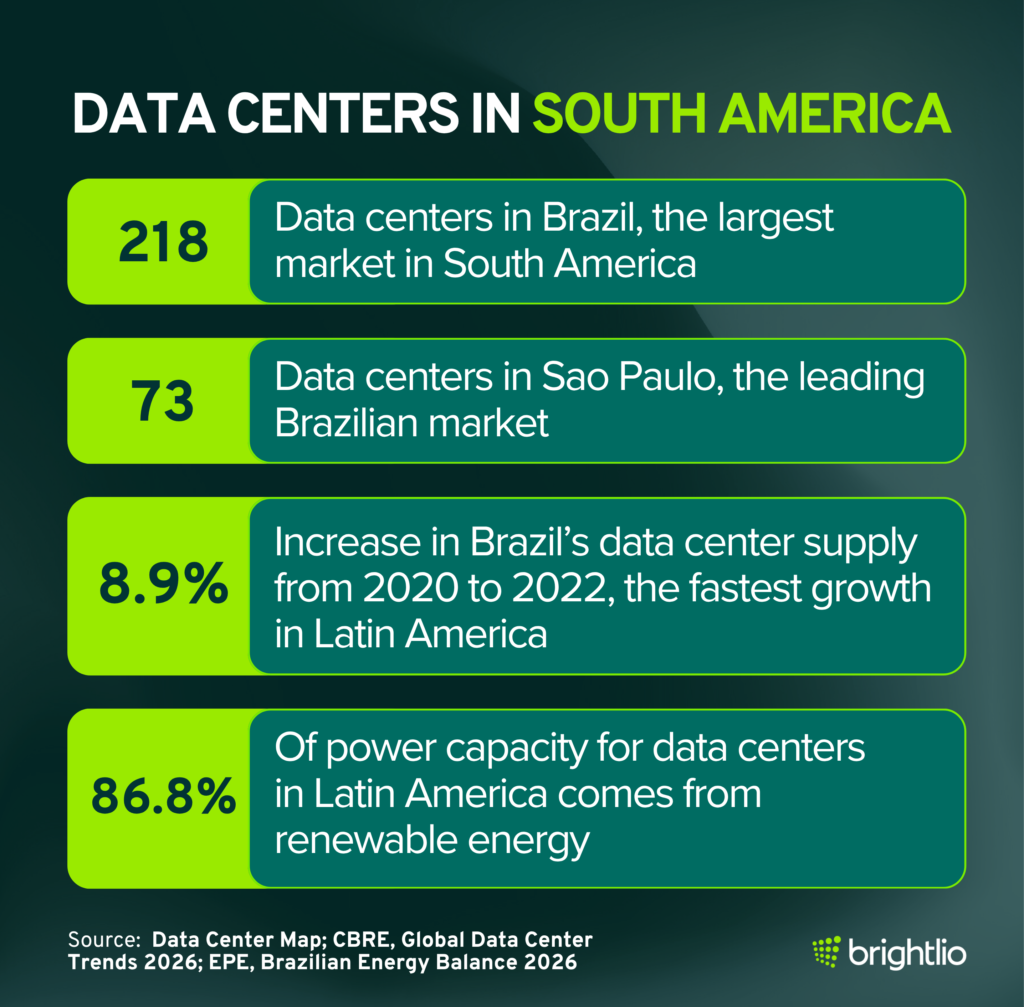
- South America has 438 data centers across 16 countries. Brazil leads with 218, followed by Chile with 65, Argentina with 47, Colombia with 39, and Peru with 14. (Source: Data Center Map)
- Brazil has 218 data centers across 37 markets. São Paulo leads the country with 59, followed by Campinas with 30, Rio de Janeiro with 23, Porto Alegre with 15, and Fortaleza with 11. (Source: Data Center Map)
- Chile has 65 data centers across 8 markets, including 55 in Santiago. (Source: Data Center Map)
- Argentina has 47 data centers across 10 markets, including 31 in Buenos Aires. (Source: Data Center Map)
- South America’s data center market is valued at approximately US$4.19 billion in 2026 and is projected to reach US$7.05 billion by 2031, representing a 10.96% CAGR. (Source: Mordor Intelligence)
- Installed data center IT capacity is projected to increase from approximately 1.51 GW in 2025 to 2.23 GW by 2030, representing an 8.16% CAGR. (Source: Mordor Intelligence)
- Colocation accounted for 76.02% of South America’s data center market in 2025, while large facilities represented 53.62% of the market. (Source: Mordor Intelligence)
- IT and telecommunications accounted for 57.92% of the regional data center market in 2025. (Source: Mordor Intelligence)
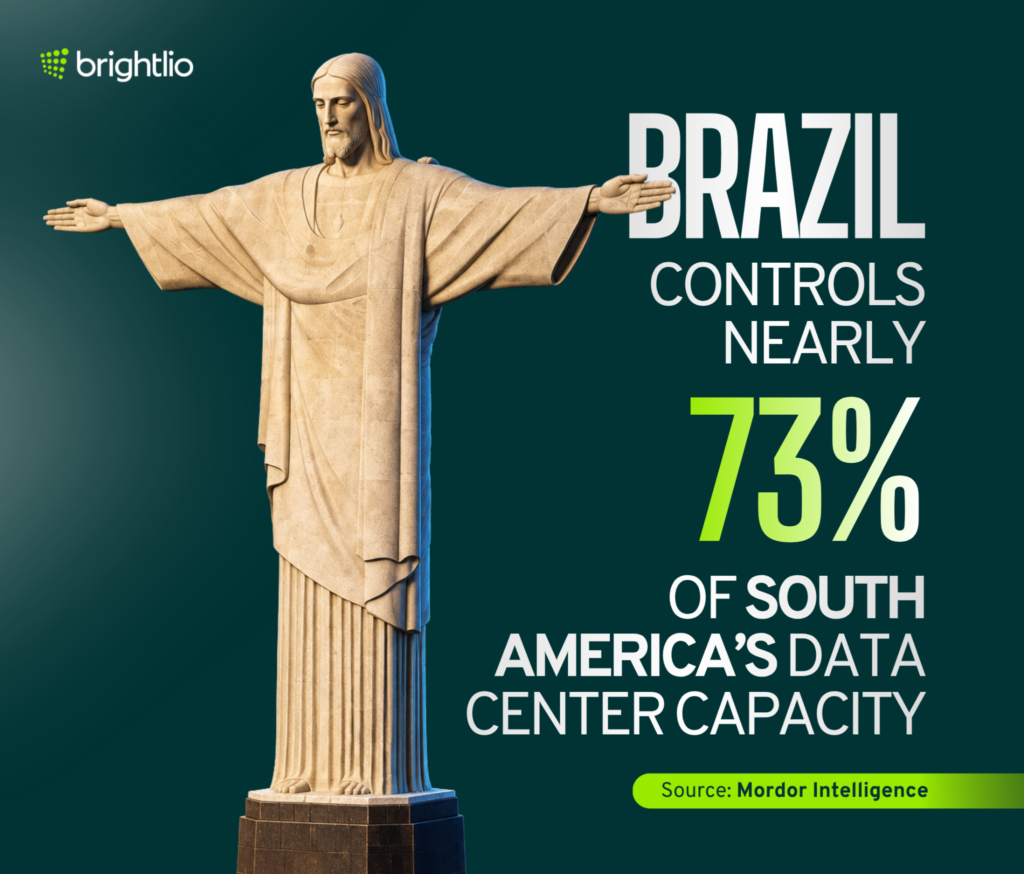
- Brazil accounted for 72.88% of South America’s installed data center capacity in 2025. (Source: Mordor Intelligence)
- South America’s AI data center market is valued at approximately US$1.24 billion in 2026 and is projected to reach US$2.72 billion by 2031, representing a 16.98% CAGR. (Source: Mordor Intelligence)
- Brazil accounted for 56.7% of South America’s AI data center market in 2025, while Argentina is projected to record the region’s fastest growth at an 18.05% CAGR through 2031. (Source: Mordor Intelligence)
- Cloud service providers accounted for 55.2% of South America’s AI data center market in 2025, while AI-focused colocation is projected to grow at an 18.55% CAGR through 2031. (Source: Mordor Intelligence)
- Tier IV facilities represented 61.05% of South America’s AI data center market in 2025. (Source: Mordor Intelligence)
- South America’s hyperscale data center market is valued at approximately US$6.69 billion in 2026 and is projected to reach US$15.92 billion by 2031, representing an 18.94% CAGR. (Source: Mordor Intelligence)
- South America’s data center construction market is valued at approximately US$5.72 billion in 2026 and is projected to reach US$8.88 billion by 2031, representing a 9.18% CAGR. (Source: Mordor Intelligence)
- Colocation accounted for 55.63% of the regional data center construction market in 2025, while self-built hyperscale facilities are projected to grow at an 11.76% CAGR through 2031. (Source: Mordor Intelligence)
- Cooling systems accounted for 40.86% of South America’s data center construction spending in 2025, while power-backup infrastructure represented 58.73% of electrical infrastructure spending. (Source: Mordor Intelligence)
- Inventory across São Paulo, Santiago, and Bogotá reached 746.8 MW in Q1 2026. São Paulo accounted for 536.7 MW, Santiago 165.8 MW, and Bogotá 44.3 MW. (Source: CBRE)
- São Paulo data center inventory increased 8.9% year over year to 536.7 MW in Q1 2026. The market had 51.5 MW of available capacity and a 9.6% vacancy rate. (Source: CBRE)
- Santiago data center inventory increased 12% year over year to 165.8 MW in Q1 2026. Available capacity stood at only 5.4 MW, producing a 3.3% vacancy rate. (Source: CBRE)
- Bogotá had 44.3 MW of data center inventory in Q1 2026, including 36 MW of occupied capacity and 8.3 MWavailable. The vacancy rate stood at 18.7%. (Source: CBRE)
- Brazil’s data center market is valued at approximately US$3.38 billion in 2026 and is projected to reach US$6.67 billion by 2031, representing a 14.58% CAGR. (Source: Mordor Intelligence)
- Brazil’s installed data center IT capacity reached approximately 1.03 GW in 2026 and is projected to increase to approximately 1.46 GW by 2030. (Source: Mordor Intelligence)
- Colocation accounted for 83.12% of Brazil’s data center market in 2025, while São Paulo represented 42.1% of the national market. (Source: Mordor Intelligence)
- Chile’s installed data center capacity is projected to increase from 410.59 MW in 2026 to 596.24 MW by 2031, representing a 7.75% CAGR. (Source: Mordor Intelligence)
The Bottom Line: How Can Brightlio Help?
Brightlio offers partners with industry-leading colocation providers to deliver colocation quotes to meet your needs and budget. If you are in the market for colocation services anywhere globally, contact Brightlio.
Brightlio also offers other technology solutions, including unified communications, connectivity, cloud services, and managed services advisory. We are committed to being your most trusted and responsive IT solutions provider.
Get started with Brightlio today!
Are you also interested in cloud services? If so, you will enjoy “295 Interesting Stats About Cloud Computing“.
FAQs
1. What is the growth rate of the data center industry?
The data center industry continues to expand rapidly as demand for cloud computing, artificial intelligence, digital services, and high-performance computing increases.
Growth estimates vary depending on whether a study measures data center facilities, infrastructure, services, or capacity.
For example, the International Energy Agency projects global data center electricity consumption to grow by about 15% annually between 2024 and 2030, reflecting the rapid expansion of computing infrastructure worldwide.
2. How is data center capacity measured?
Data center capacity is most commonly measured in megawatts (MW) of critical IT power. Large campuses may be measured in gigawatts (GW).
Other important measures include square footage, rack capacity, power density, cooling capacity, network connectivity, and Power Usage Effectiveness (PUE). For modern hyperscale and AI data centers, power capacity is generally more useful than floor area alone.
3. How many data centers are there worldwide in 2026?
There is no single universally accepted global total because different databases use different definitions and tracking methods. Cloudscene data cited by Statista listed more than 11,700 operational data centers worldwide in May 2026.
Counts may exclude some private enterprise, edge, government, or small facilities, so global totals should be treated as estimates rather than exact figures.
4. How many data centers are in the United States in 2026?
The United States has more data centers than any other country. Cloudscene data cited by Statista listed approximately 5,427 U.S. data centers in May 2026, representing about 46% of the worldwide facilities in that dataset.
Other databases report lower totals because they use different definitions and inclusion criteria.
5. Which countries have the most data centers?
The United States leads the world by a substantial margin. Based on Cloudscene data reported in May 2026, the next-largest markets included Germany, the United Kingdom, China, and Canada.
These countries benefit from strong digital economies, extensive fiber connectivity, established cloud markets, and access to large amounts of power.
6. How many hyperscale data centers are there worldwide?
There were approximately 1,360 large hyperscale data centers operating worldwide at the end of 2025, according to Synergy Research Group.
Hyperscale facilities accounted for about 48% of worldwide data center capacity, and their share is expected to continue increasing as cloud and AI infrastructure expands.
7. How many hyperscale data centers are in the United States?
The United States had approximately 580 operational hyperscale data centers at the end of 2025, according to Synergy Research Group.
Another 437 U.S. hyperscale facilities were included in the company’s known development pipeline at the time of its 2026 analysis.
8. How much electricity do data centers use worldwide?
Data centers consumed approximately 415 terawatt-hours (TWh) of electricity globally in 2024, equivalent to about 1.5% of worldwide electricity consumption.
The International Energy Agency projects consumption could reach approximately 945 TWh by 2030, or just under 3% of global electricity demand. AI and accelerated computing are major drivers of this increase.
10. How much electricity do U.S. data centers use?
U.S. data center electricity demand is rising rapidly. Lawrence Berkeley National Laboratory’s 2026 update projects a reference-case consumption level of approximately 649 TWh in 2030.
Depending on factors such as AI hardware deployment, utilization, and efficiency, consumption could range from approximately 521 TWh to 843 TWh, equivalent to about 9.5% to 15.3% of total U.S. electricity use.
11. Why is AI increasing data center electricity demand?
AI systems require large numbers of high-performance GPUs and other accelerators for model training and inference. These servers can consume substantially more electricity and generate more heat than conventional computing equipment.
The IEA projects electricity consumption from accelerated servers to grow by approximately 30% per year through 2030 in its base case.
12. How much water do data centers use?
Water use varies significantly depending on cooling technology, climate, facility design, workload, and electricity source. U.S. data centers directly consumed approximately 66 billion liters, or 17.4 billion gallons, of water in 2023.
Their indirect water footprint associated with electricity generation was substantially larger. Water availability is becoming an increasingly important consideration when new data center campuses are planned.
13. What are Tier I, Tier II, Tier III, and Tier IV data centers?
The Uptime Institute classifies data center infrastructure into four official Tiers:
- Tier I — Basic Capacity: Provides basic dedicated infrastructure for IT operations.
- Tier II — Redundant Capacity Components: Adds redundant power and cooling components.
- Tier III — Concurrently Maintainable: Allows planned maintenance of infrastructure components without interrupting IT operations.
- Tier IV — Fault Tolerant: Provides the highest Tier level, designed so an individual equipment failure or distribution-path interruption does not affect IT operations.
The Tier system evaluates infrastructure topology and resilience rather than simply assigning a guaranteed percentage of annual uptime.
14. What is a Tier 5 or Level 5 data center?
There is no official Tier V classification in the Uptime Institute system. Uptime Institute recognizes only Tier I through Tier IV. Some data center companies use proprietary terms such as “Tier 5,” but these should not be confused with an official Uptime Institute certification.
15. What is the largest data center in the world?
The answer depends on how “largest” is measured. Data centers can be ranked by floor area, campus acreage, power capacity, IT capacity, or number of buildings, and these rankings do not always identify the same facility.
For example, Switch’s Citadel Campus in Nevada was designed for up to 7.2 million square feet of data center space and 650 MW of power, making it one of the world’s largest data center campuses.
For a statistics article, it is more accurate to specify the measurement being used rather than identify one facility as unquestionably the world’s largest.
16. How large is a typical data center?
There is no meaningful universal “average” size. An edge data center may occupy only a small building or modular facility, while a hyperscale campus can contain multiple large buildings and hundreds of megawatts of IT capacity. For this reason, modern data center scale is increasingly compared using MW of critical IT load rather than square footage alone.
17. How many people work in data centers?
Data centers employ workers across facility operations, electrical and mechanical engineering, networking, cybersecurity, construction, maintenance, and other technical roles.
U.S. data center employment increased from approximately 306,000 workers in 2016 to around 501,000 in 2023, illustrating the industry’s expanding economic footprint.
18. What do H5 Data Centers do?
H5 Data Centers provides colocation and mission-critical data center infrastructure services for enterprises and other organizations. As of 2026, the company reports managing more than 4 million square feet of data center space across 25 U.S. markets.
19. Why are so many new data centers being built?
New data center development is being driven primarily by AI, cloud computing, digital services, streaming, enterprise cloud migration, and growing storage and processing requirements. Increasing demand for AI infrastructure is also leading developers to build larger campuses with substantially higher power densities than earlier generations of data centers.
20. What are the biggest challenges facing data centers in 2026?
The biggest constraints on data center expansion include access to electricity, grid-interconnection delays, transmission capacity, water availability, cooling requirements, land availability, equipment supply chains, permitting, and construction costs.
Power availability has become especially important as AI-oriented campuses move from tens or hundreds of megawatts toward gigawatt-scale development.
21. Will data center demand continue growing through 2030?
Current forecasts strongly suggest continued growth. The IEA expects worldwide data center electricity use to reach around 945 TWh by 2030, more than twice the 2024 level.
Synergy Research Group also expects hyperscale operators to control an increasing share of global data center capacity as major cloud and technology companies continue expanding their infrastructure.

John Minnix is the Founder and CEO of Brightlio, with two decades of experience in data center, cloud, and network solutions. He previously built VPLS Solutions into a top Southern California technology partner before its acquisition by Evocative, where he served as President and COO overseeing global sales, operations, and strategic acquisitions.
Recent Posts
What Is a Data Center?
10 Largest AI Data Centers in the World

Data Centers In Oklahoma: Why You Must Colocate

Data Center and Colocation In North Dakota
Let's start
a new project together