

Cloud adoption and infrastructure spending continue to grow rapidly. Brightlio has compiled current cloud computing facts to help you follow the industry’s most important trends.
In this article, you’ll find more than 300 sourced cloud computing statistics, including:
- Global cloud computing market statistics
- Cloud adoption by country and by region, including Europe, North America, South America, Asia-Pacific, and the Middle East and Africa
- Cloud technology segments, including edge computing, cloud AI, and serverless computing
- Global cloud computing and infrastructure statistics by vendor
Cloud Computing Market Size and Growth
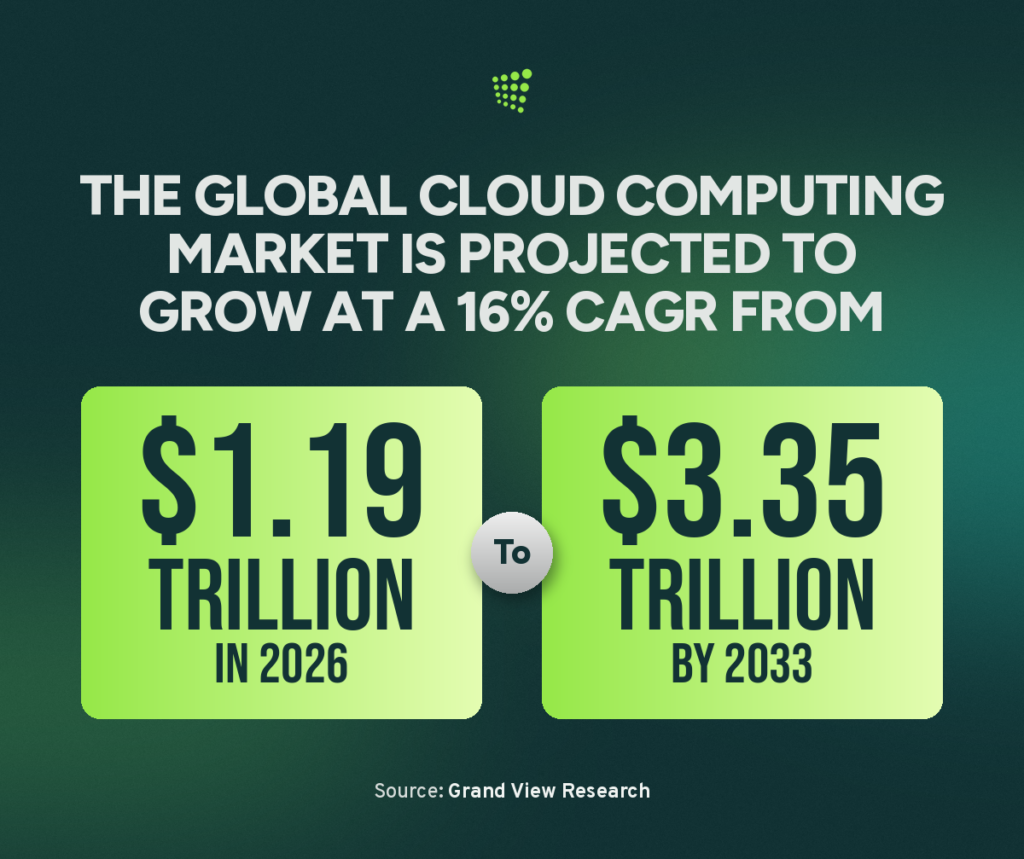
- The global cloud computing market is valued at $1.1881 trillion in 2026. (Source: Grand View Research)
- The global cloud computing market is projected to reach $3.35 trillion by 2033. (Source: Grand View Research)
- The global cloud computing market is projected to grow at a 16% CAGR through 2033. (Source: Grand View Research)
- North America accounted for 38.6% of global cloud computing revenue in 2025. (Source: Grand View Research)
- Software as a Service (SaaS) accounted for 53.6% of global cloud computing revenue in 2025. (Source: Grand View Research)
- Public cloud deployments accounted for 52.6% of global cloud computing revenue in 2025. (Source: Grand View Research)
- Resource management accounted for 34% of the cloud computing market by workload in 2025. (Source: Grand View Research)
- The U.S. cloud computing market was valued at $523.29 billion in 2025. (Source: Precedence Research)
- The U.S. cloud computing market is projected to reach $3.46 trillion by 2035. (Source: Precedence Research)
- Worldwide Infrastructure as a Service (IaaS) spending is projected to reach $287 billion in 2026. (Source: Gartner)
- Enterprise spending on cloud infrastructure services reached $143.4 billion in Q2 2026. (Source: Synergy Research Group)
- Global cloud infrastructure services revenue grew 43% year over year in Q2 2026. (Source: Synergy Research Group)
- Cloud infrastructure services generated $500 billion in trailing 12-month revenue through Q2 2026. (Source: Synergy Research Group)
- Public IaaS and PaaS revenue grew 47% year over year in Q2 2026. (Source: Synergy Research Group)
- GenAI-specific cloud services revenue grew 165% year over year in Q2 2026. (Source: Synergy Research Group)
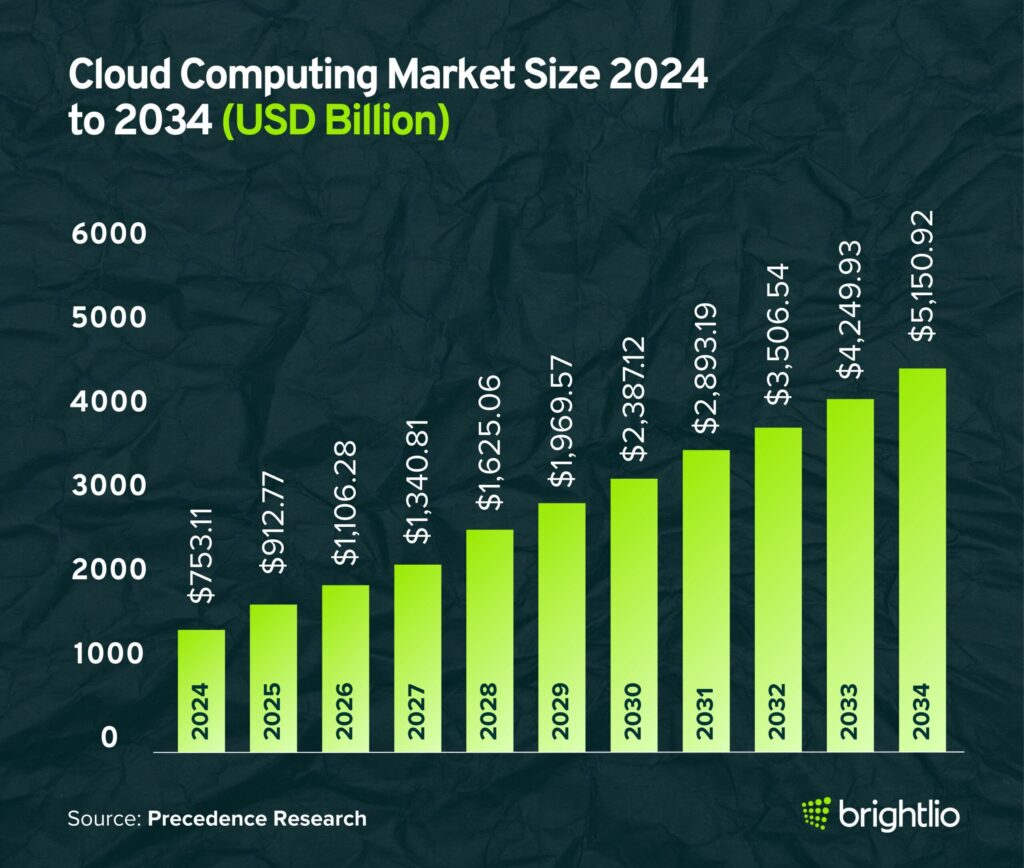
Cloud Computing Usage and Adoption Statistics
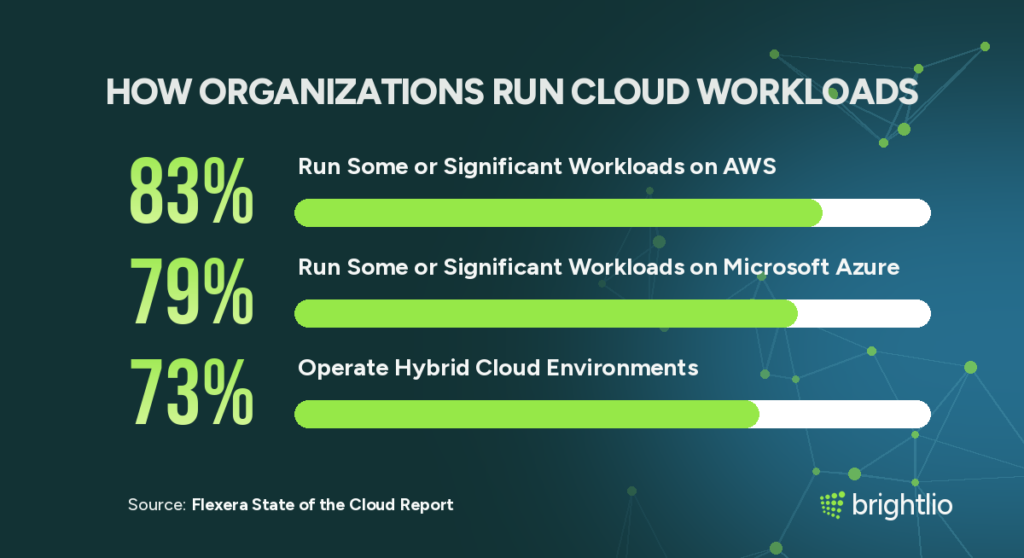
- 88% of organizations use a multi-cloud environment in 2026. (Source: Flexera)
- 73% of organizations operate hybrid cloud environments in 2026. (Source: Flexera)
- 63% of SMB workloads run in the public cloud in 2026. (Source: Flexera)
- 61% of SMB data is stored in the public cloud in 2026. (Source: Flexera)
- 51% of enterprise data is stored in the public cloud in 2026. (Source: Flexera)
- 54% of enterprise workloads run in the public cloud in 2026. (Source: Flexera)
- 83% of organizations run some or significant workloads on AWS in 2026. (Source: Flexera)
- 79% of organizations run some or significant workloads on Microsoft Azure in 2026. (Source: Flexera)
- Public cloud data warehouse services are used by 71% of organizations in 2026. (Source: Flexera)
- Generative AI public cloud services are used by 58% of organizations in 2026. (Source: Flexera)
Global Cloud Computing and Infrastructure Statistics

- The earliest documented references to the term “cloud computing” date to 1996 and are linked to George Favaloro of Compaq and Sean O’Sullivan of NetCentric. (Source: MIT Technology Review)
- Worldwide Infrastructure as a Service (IaaS) spending reached $222 billion in 2025. (Source: Gartner)
- Worldwide IaaS spending is projected to grow 29.3% in 2026. (Source: Gartner)
- Global public cloud services spending is forecast to surpass $1 trillion in 2026. (Source: IDC)
- Global public cloud services spending is projected to grow more than 21% in 2026. (Source: IDC)
- Platform as a Service (PaaS) spending is projected to grow more than 37% in 2026. (Source: IDC)
- Hyperscale operators account for 48% of worldwide data center capacity. (Source: Synergy Research Group)
- The number of large data centers operated by hyperscale companies reached 1,360 at the end of 2025. (Source: Synergy Research Group)
- The global private cloud computing market was valued at $438.78 billion in 2025. (Source: Grand View Research)
- The global private cloud computing market is projected to grow at a 21.3% CAGR through 2033. (Source: Grand View Research)
Cloud Computing Cost and Efficiency Stats
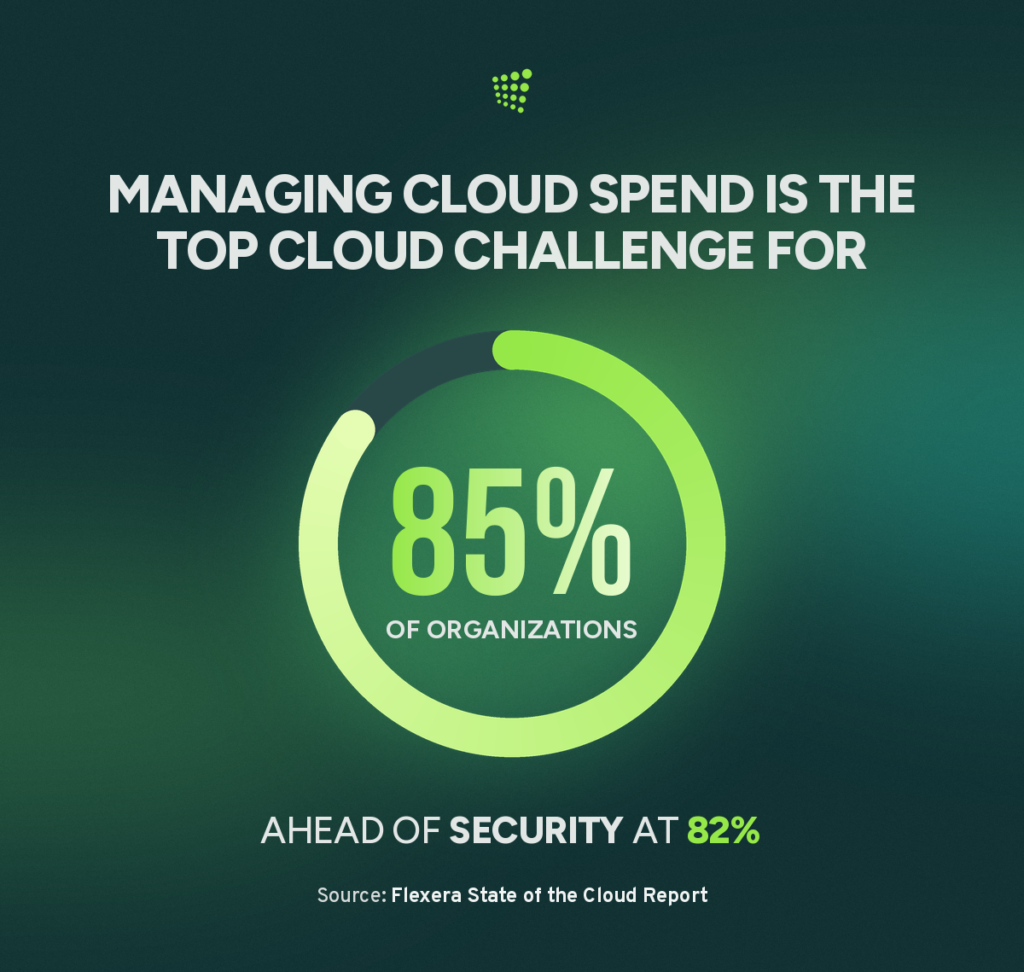
- Managing cloud spending is a leading cloud challenge for 85% of organizations in 2026. (Source: Flexera)
- Organizations estimate that 29% of their IaaS and PaaS cloud spending is wasted. (Source: Flexera)
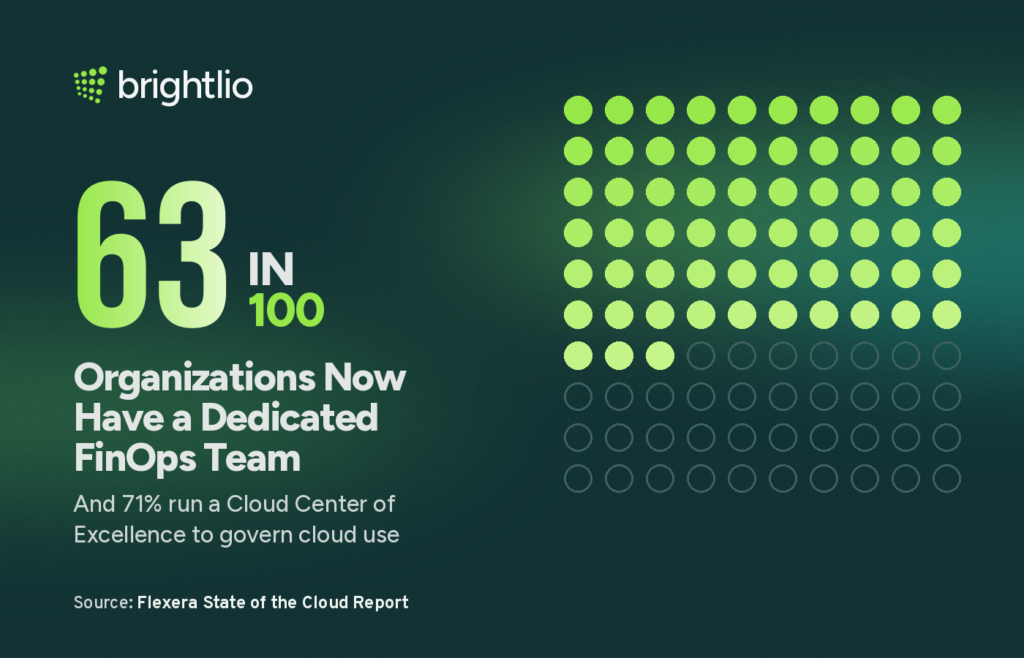
- 63% of organizations have a FinOps team focused on cloud cost optimization. (Source: Flexera)
- 71% of organizations operate a Cloud Center of Excellence or similar centralized cloud team. (Source: Flexera)
- Optimizing existing cloud use for cost savings is a top cloud initiative for 68% of organizations. (Source: Flexera)
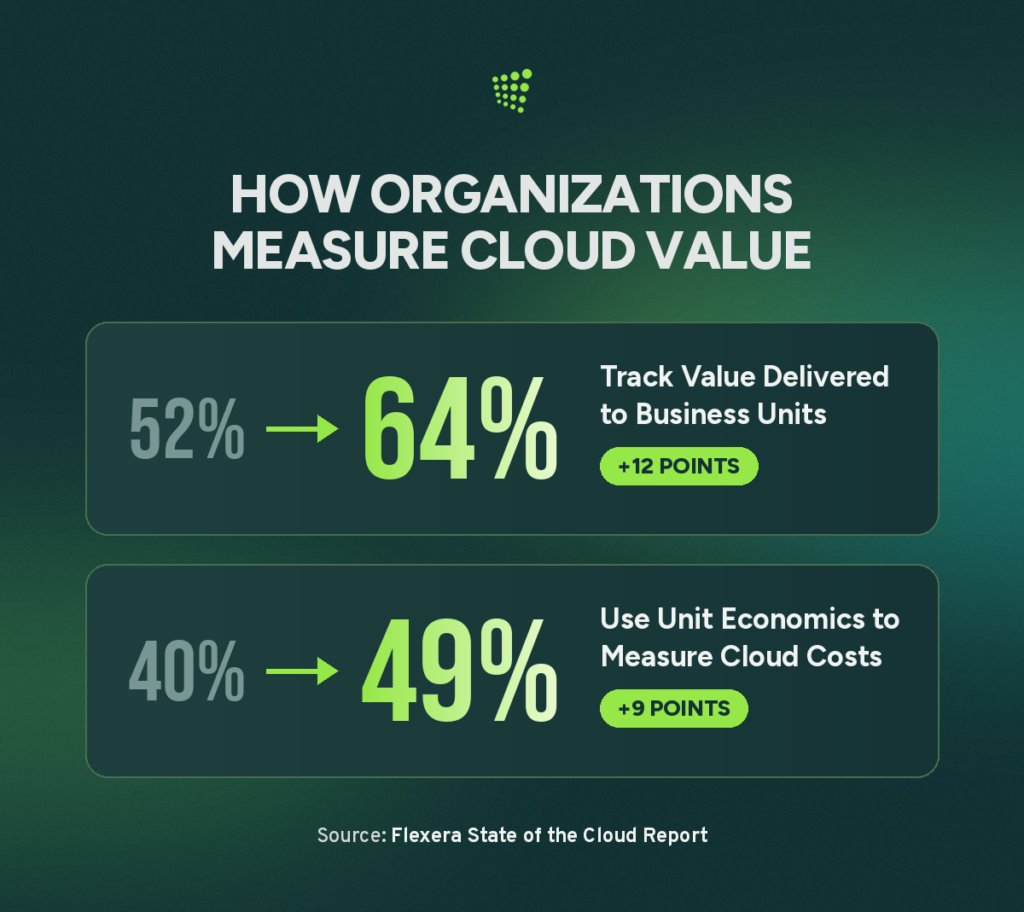
- 49% of organizations use unit metrics to measure cloud costs against business outcomes. (Source: Flexera)
- 17% of organizations exceeded their public cloud budgets during the previous year. (Source: Flexera)
- Value delivered to business units is used to measure progress toward cloud goals by 64% of organizations. (Source: Flexera)
Cloud Security and Compliance in Cloud Computing
- Cloud storage ranks as a leading cyberattack target for 35% of organizations in 2026. (Source: Thales)
- Credential theft and misappropriated secrets are increasing as cloud attack techniques for 67% of organizations. (Source: Thales)
- Sensitive information accounts for 51% of data stored in cloud environments. (Source: Thales)
- Organizations encrypt 47% of their sensitive cloud data. (Source: Thales)
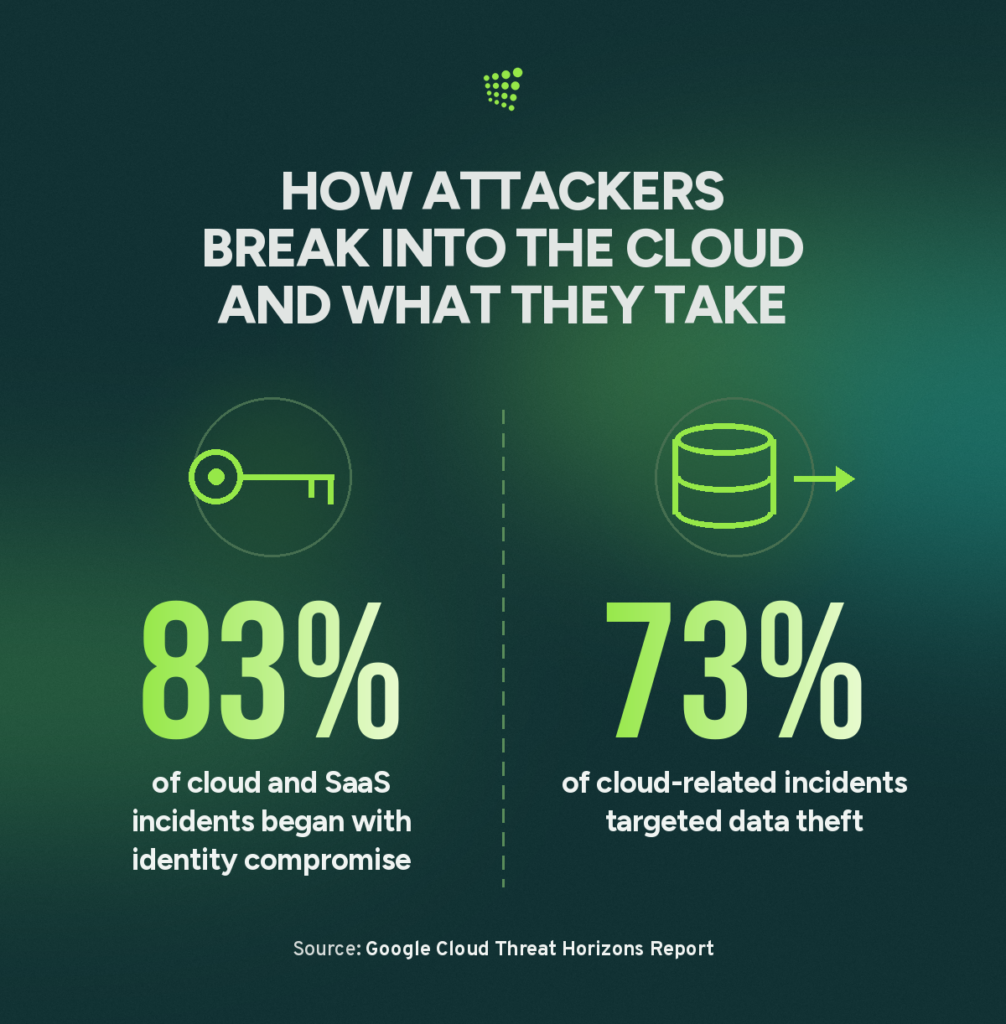
- Identity issues provided initial access in 83% of incidents involving major cloud and SaaS environments during the second half of 2025. (Source: Google Cloud)
- Data theft was the objective in 73% of cloud-related incidents examined during the second half of 2025. (Source: Google Cloud)
- Cloud-conscious intrusions increased 37% in 2025. (Source: CrowdStrike)
- Security and compliance risks associated with cloud-based AI are the leading challenge for 53% of organizations scaling AI workloads in the cloud. (Source: Flexera) In Orca Security’s 2025 cloud analysis, 62% of organizations had at least one vulnerable AI package in their cloud environment. (Source: Orca Security; related cloud security statistics.)
Cloud Technology Segment Statistics
- The global edge computing market is valued at $46.7 billion in 2026. (Source: Grand View Research)
- The global edge computing market is projected to reach $328.0 billion by 2033. (Source: Grand View Research)
- The edge computing market is projected to grow at a 32.1% CAGR through 2033. (Source: Grand View Research)
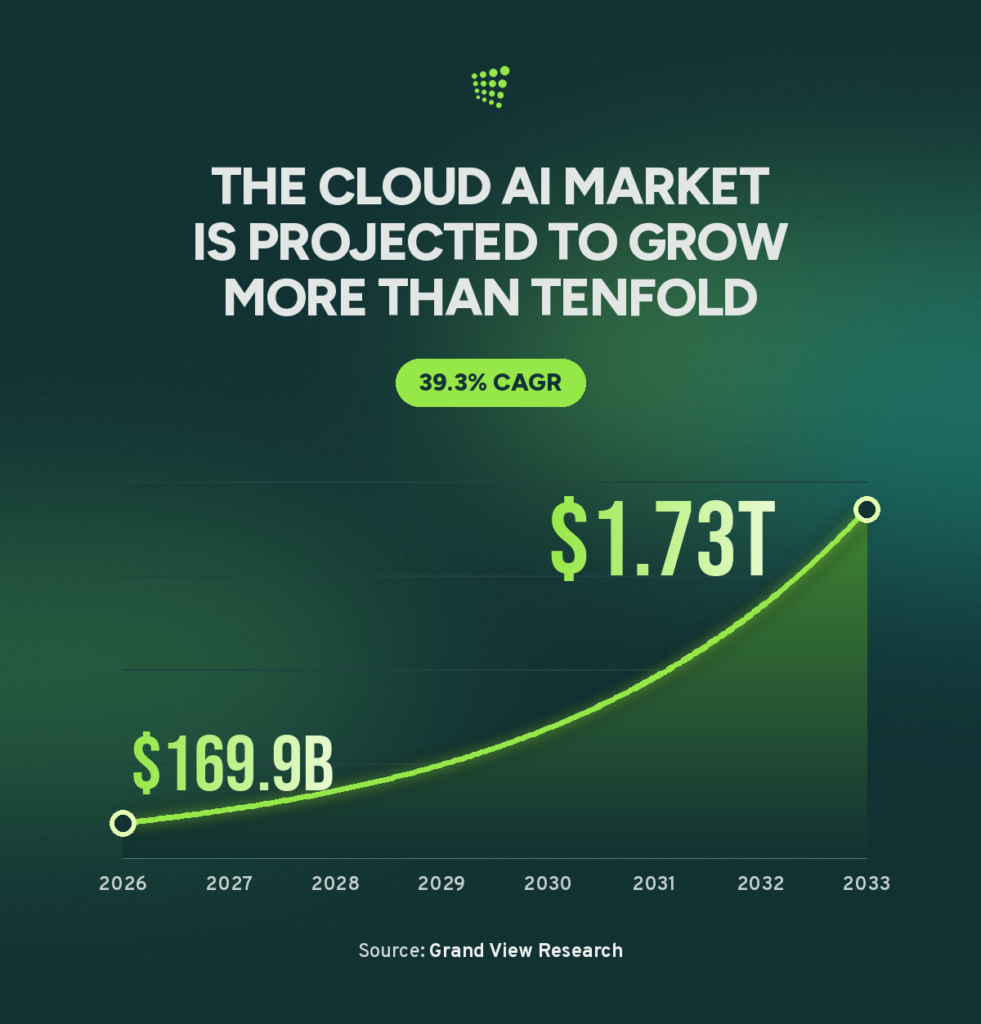
- The global cloud AI market is valued at $169.9 billion in 2026. (Source: Grand View Research)
- The global cloud AI market is projected to reach $1,728.4 billion by 2033. (Source: Grand View Research)
- The cloud AI market is projected to grow at a 39.3% CAGR through 2033. (Source: Grand View Research)
- The global serverless computing market is valued at $29.9 billion in 2026. (Source: Grand View Research)
- The global serverless computing market is projected to reach $52.1 billion by 2030. (Source: Grand View Research)
- The serverless computing market is projected to grow at a 14.1% CAGR through 2030. (Source: Grand View Research)
Cloud Computing Market Leaders and Segments
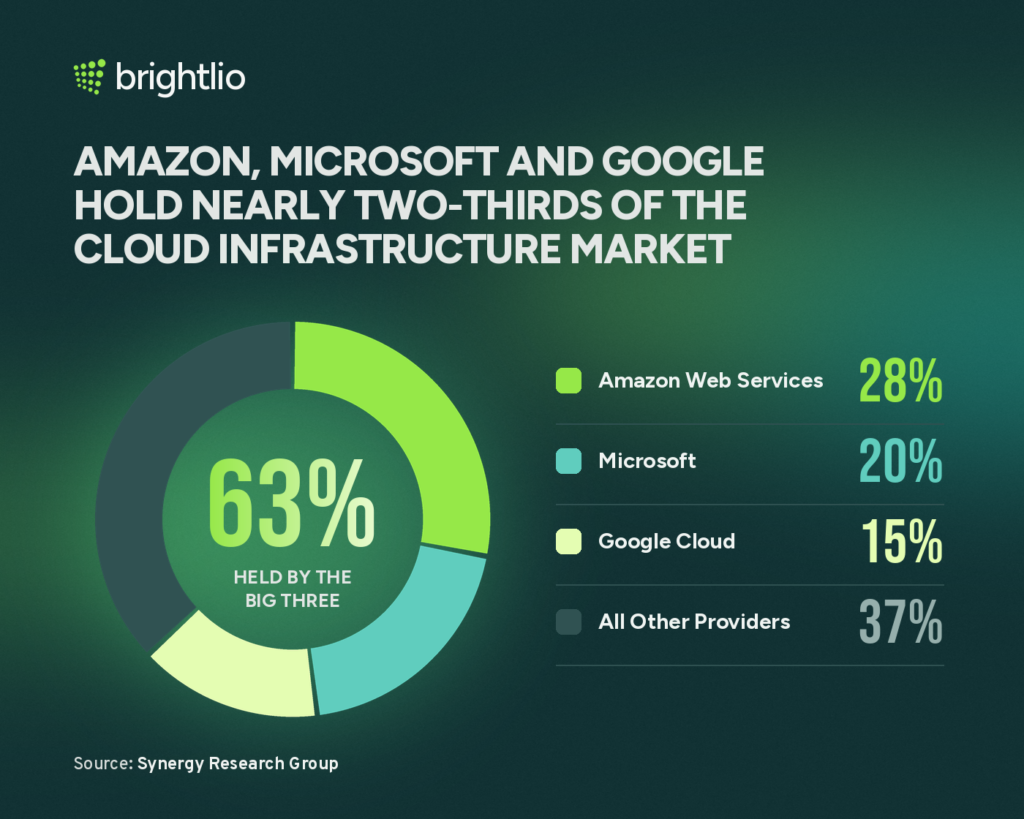
- Amazon Web Services (AWS) held 28% of the global cloud infrastructure services market in Q2 2026. (Source: Synergy Research Group)
- Microsoft held 20% of the global cloud infrastructure services market in Q2 2026. (Source: Synergy Research Group)
- Google Cloud held 15% of the global cloud infrastructure services market in Q2 2026. (Source: Synergy Research Group)
- AWS, Microsoft, and Google collectively controlled 63% of the global cloud infrastructure services market in Q2 2026. (Source: Synergy Research Group)
Cloud Computing Statistics by Region
Cloud markets differ by region because adoption, regulation, infrastructure, and enterprise demand vary. The following sections summarize key regional figures.
Cloud Computing Statistics for North America
- The North American public cloud market is valued at $401.71 billion in 2026. (Source: Grand View Research)
- The North American public cloud market is projected to reach $1.00 trillion by 2033. (Source: Grand View Research)
- The North American public cloud market is projected to grow at a 13.9% CAGR through 2033. (Source: Grand View Research)
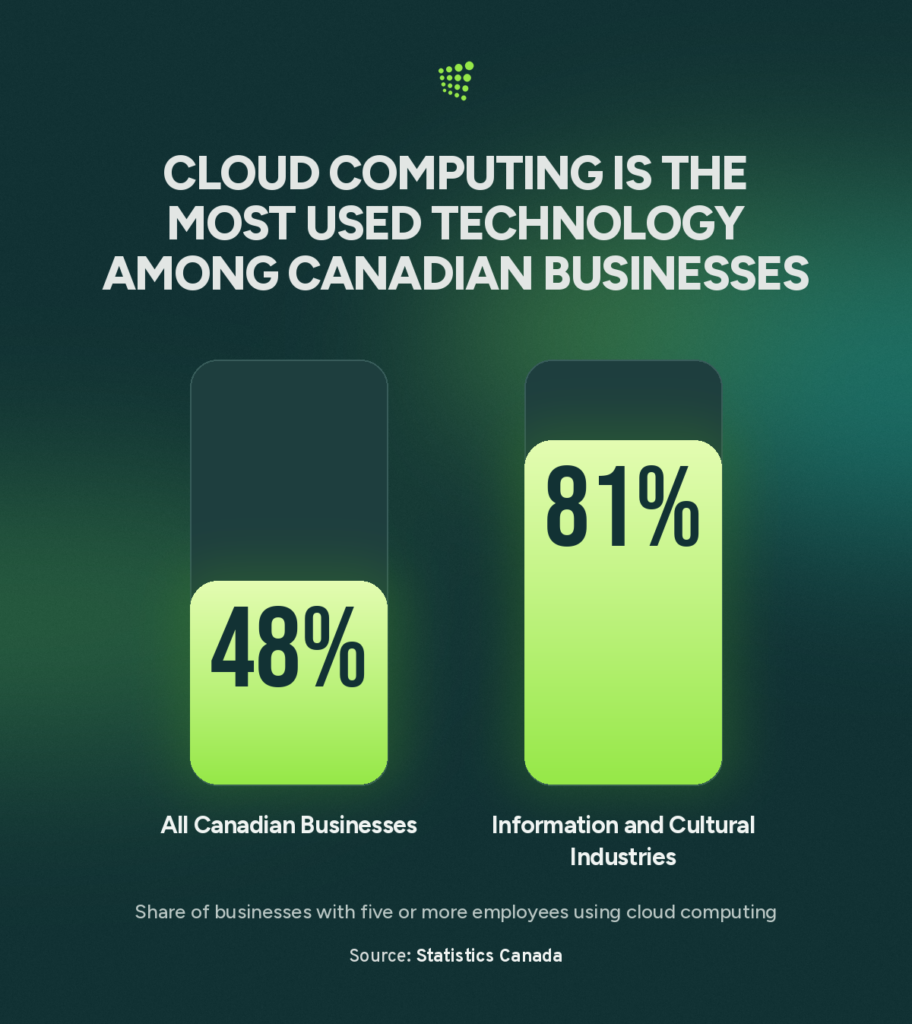
- 48% of Canadian businesses used cloud computing in 2023. (Source: Statistics Canada)
- Cloud computing was used by 81% of Canadian businesses in the information and cultural industries sector in 2023. (Source: Statistics Canada)
- AWS Mexico Central operates across 3 Availability Zones. (Source: Amazon Web Services)
- AWS plans to invest more than $5 billion in its Mexico cloud infrastructure expansion. (Source: Amazon Web Services)
- Google Cloud’s Querétaro cloud region is projected to contribute more than $11 billion to Mexico’s GDP by 2030. (Source: Google Cloud)
Cloud Computing Statistics for South America
- South America’s cloud computing market reached $55.21 billion in 2025. (Source: Mordor Intelligence)
- By 2030, cloud computing revenue across South America is forecast to reach $88.17 billion. (Source: Mordor Intelligence)
- Regional cloud computing revenue is expected to expand at a 9.81% CAGR through 2030. (Source: Mordor Intelligence)
- Public cloud generated 71.97% of South American cloud computing revenue in 2024. (Source: Mordor Intelligence)
- Hybrid cloud is the region’s fastest-growing deployment model, with an 11.04% CAGR forecast through 2030. (Source: Mordor Intelligence)
- SaaS led South America’s cloud service segments with a 53.19% market share in 2024. (Source: Mordor Intelligence)
- PaaS is forecast to grow at a 10.35% CAGR through 2030. (Source: Mordor Intelligence)
- Large enterprises generated 62.24% of regional cloud computing revenue in 2024. (Source: Mordor Intelligence)
- Banking, financial services, and insurance led end-user industries with a 21.13% revenue share in 2024. (Source: Mordor Intelligence)
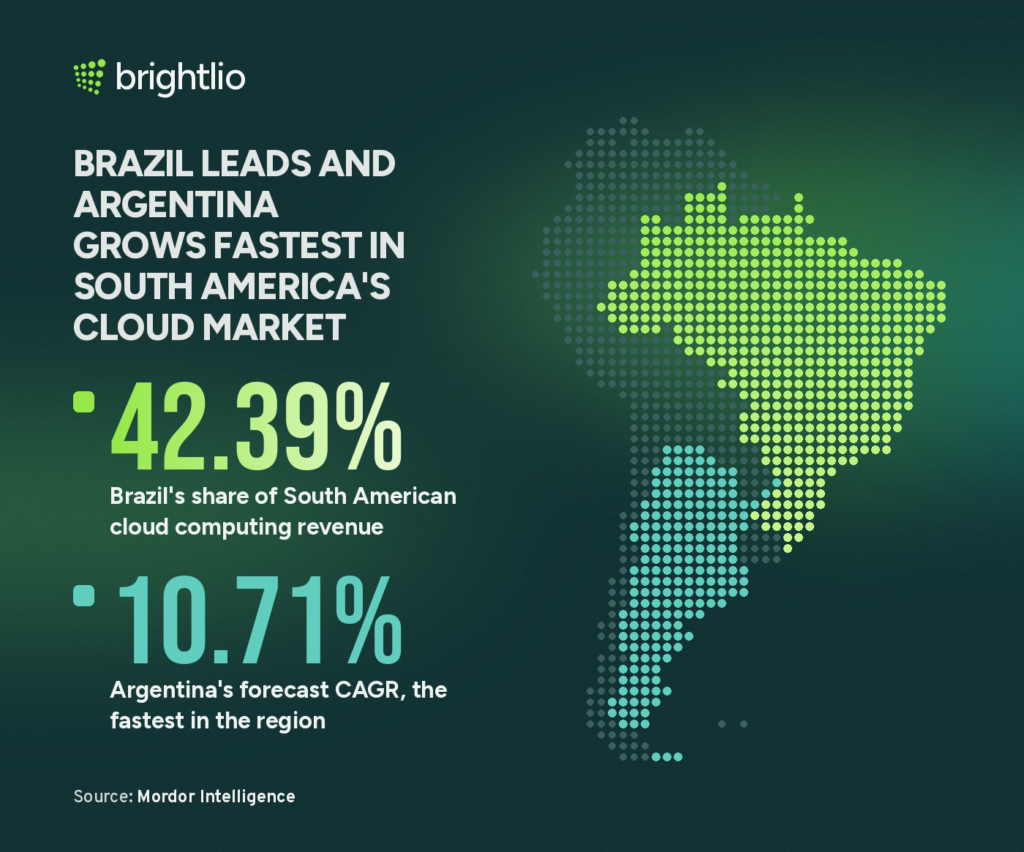
- Brazil remained South America’s largest cloud computing market, holding a 42.39% share in 2024. (Source: Mordor Intelligence)
- Argentina is expected to record the region’s fastest national-market growth, with a 10.71% CAGR through 2030. (Source: Mordor Intelligence)
- 73% of South American organizations plan to put AI workloads into production within the next 12 months. (Source: Mordor Intelligence)
Cloud Computing Statistics for the Middle East and Africa
- The Middle East and Africa public cloud market is valued at $85.72 billion in 2026. (Source: Grand View Research)
- The region generated 8.4% of global public cloud revenue in 2025. (Source: Grand View Research)
- By 2033, public cloud revenue across the Middle East and Africa is forecast to reach $188.56 billion. (Source: Grand View Research)
- The Middle East and Africa public cloud market is projected to grow at an 11.9% CAGR through 2033. (Source: Grand View Research)
- Sovereign cloud revenue across the Middle East and Africa reached $8.16 billion in 2025. (Source: Grand View Research)
- The region’s sovereign cloud market is projected to grow at a 23.3% CAGR through 2033. (Source: Grand View Research)
- Cloud managed services generated $4.7 billion across the Middle East and Africa in 2025. (Source: Grand View Research)
- Middle East and Africa cloud managed services revenue is forecast to grow at an 11.4% CAGR through 2033. (Source: Grand View Research)
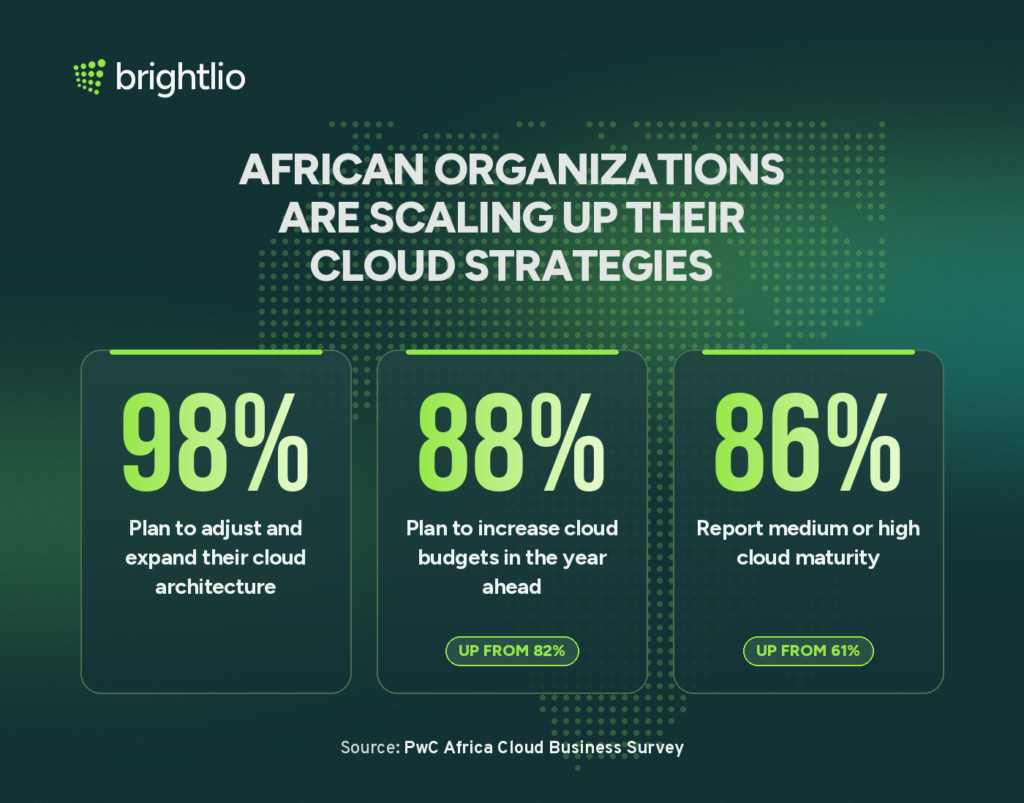
- More than 86% of African organizations reported medium or high cloud maturity in 2025. (Source: PwC)
- 98% of African organizations plan to adjust or expand their cloud architecture and coverage. (Source: PwC)
- Multi-cloud infrastructure is used by 86% of organizations across Africa. (Source: PwC)
- 88% of African organizations plan to increase their cloud budgets over the next year. (Source: PwC)
- Geopolitical and regulatory changes are prompting 89% of African organizations to refine their cloud strategies. (Source: PwC)
- Trusted national clouds are preferred by 40% of African organizations for risk reduction, resilience, and security. (Source: PwC)
- Sovereign public cloud is being used or considered by 36% of African organizations to support AI capabilities. (Source: PwC)
- Data architectures have been modernized for cloud analytics by 33% of African organizations. (Source: PwC)
- Cloud operating models have been adapted by 44% of organizations across Africa. (Source: PwC)
- Agentic AI is already in use at 37% of African organizations. (Source: PwC)
Cloud Computing Statistics for Europe
- Europe’s public cloud market is valued at $255.14 billion in 2026. (Source: Grand View Research)
- Public cloud revenue across Europe is forecast to reach $649.13 billion by 2033. (Source: Grand View Research)
- The European public cloud market is projected to grow at a 14.3% CAGR through 2033. (Source: Grand View Research)
- Europe generated 24.5% of global public cloud revenue in 2025. (Source: Grand View Research)
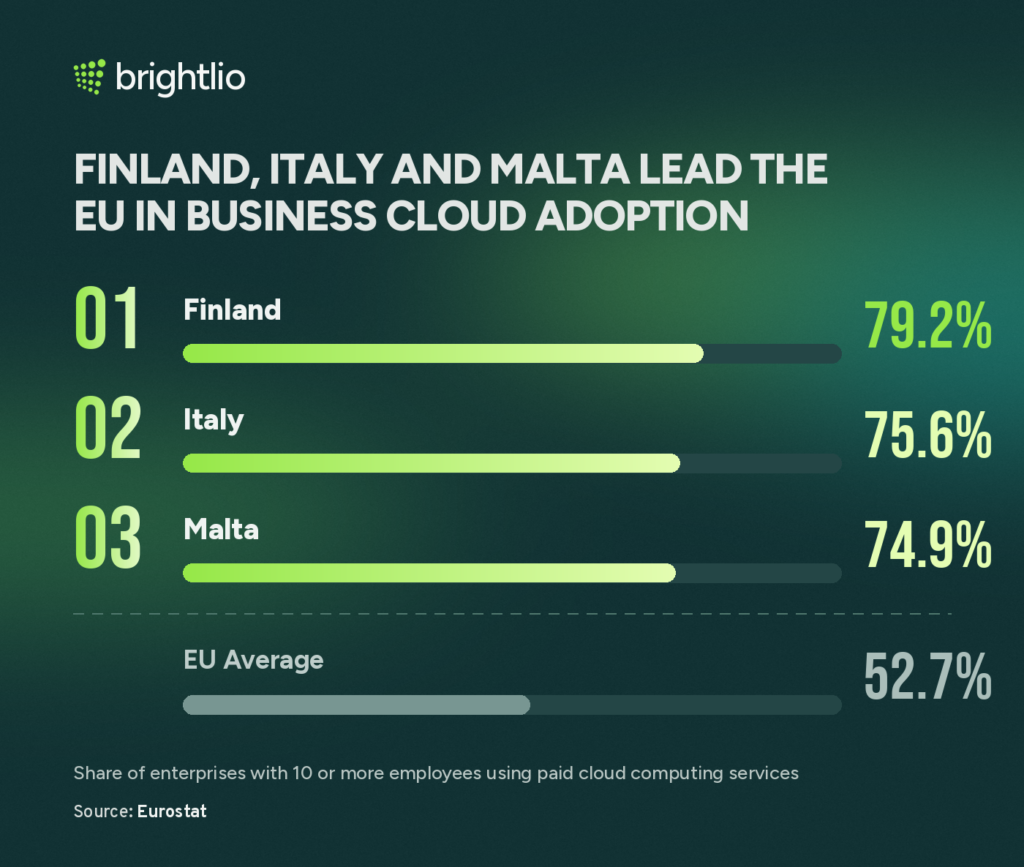
- Paid cloud computing services were used by 52.7% of EU enterprises in 2025. (Source: Eurostat)
- Cloud adoption among large EU enterprises reached 84.7% in 2025. (Source: Eurostat)
- Finland recorded the EU’s highest business cloud adoption rate at 79.2% in 2025. (Source: Eurostat)
- SaaS was used by 96.4% of EU enterprises that purchased paid cloud services in 2025. (Source: Eurostat)
- European cloud providers hold 15% of their regional cloud infrastructure services market. (Source: Synergy Research Group)
- AWS, Microsoft, and Google collectively control 70% of Europe’s cloud infrastructure services market. (Source: Synergy Research Group)
- Database hosting through paid cloud services was used by 45.5% of EU enterprises that purchased cloud services in 2025. (Source: Eurostat)
- E-mail was the most widely used paid cloud service among EU enterprises, reaching 85.2% in 2025. (Source: Eurostat)
- Office software was used by 71.7% of EU enterprises purchasing paid cloud services in 2025. (Source: Eurostat)
- Cloud file storage reached 71.5% adoption among EU enterprises using paid cloud services in 2025. (Source: Eurostat)
- Security software applications were purchased through the cloud by 65.5% of EU enterprises using paid cloud services in 2025. (Source: Eurostat)
- Finance and accounting software was used through paid cloud services by 58.2% of EU enterprises in 2025. (Source: Eurostat)
- Enterprise resource planning software reached 30.1% adoption among EU enterprises purchasing cloud services in 2025. (Source: Eurostat)
- Cloud-based CRM software was used by 27.9% of EU enterprises purchasing paid cloud services in 2025. (Source: Eurostat)
- Cloud platforms for application development, testing, or deployment were used by 26.1% of EU enterprises purchasing cloud services in 2025. (Source: Eurostat)
- Italy recorded paid cloud adoption of 75.6% among enterprises in 2025. (Source: Eurostat)
- Malta recorded paid cloud adoption of 74.9% among enterprises in 2025. (Source: Eurostat)
- GenAI-specific cloud services in Europe grew between 140% and 160% in 2025. (Source: Synergy Research Group)
Cloud Computing Statistics for Asia-Pacific

- Asia-Pacific’s public cloud market is valued at $224.72 billion in 2026. (Source: Grand View Research)
- By 2033, public cloud revenue across Asia-Pacific is forecast to reach $677.89 billion. (Source: Grand View Research)
- The regional public cloud market is projected to expand at a 17.1% CAGR through 2033. (Source: Grand View Research)
- Asia-Pacific generated 21% of global public cloud revenue in 2025. (Source: Grand View Research)
- Cloud computing contributed as much as 2.23% of GDP across the Asia-Pacific economies examined in the ADB study. (Source: Asian Development Bank)
- Stronger cloud-enabling policies could increase GDP growth by up to 0.7% in middle-income Asia-Pacific economies. (Source: Asian Development Bank)
- Cloud adoption generated economic value equal to 2.23% of Singapore’s GDP in 2023. (Source: Amazon Web Services)
- Microsoft committed $17.5 billion to cloud and AI infrastructure, operations, and skills development in India for 2026 through 2029. (Source: Microsoft)
- Microsoft now operates 4 cloud regions in India following the launch of its Hyderabad region in August 2026. (Source: Microsoft)
- Microsoft is investing $1.7 billion in cloud and AI infrastructure in Indonesia through 2028. (Source: Microsoft)
- AWS plans to invest at least $6 billion in its Malaysian cloud infrastructure through 2037. (Source: Amazon Web Services)
- AWS’s Malaysia cloud region became its 13th infrastructure region in Asia-Pacific when it opened in 2024. (Source: Amazon Web Services)
Is Cloud Computing in Demand?
Yes. Demand for cloud computing remains strong in 2026. Worldwide public cloud services revenue is forecast to reach $1.03 trillion in 2026. Multi-cloud environments are used by 88% of organizations. Cloud infrastructure services revenue grew 43% year over year in Q2 2026.
What Are the Four Types of Cloud Computing?
The four main deployment models of cloud computing are:
| Model | Key features | Source |
|---|---|---|
| Public cloud | Services run on shared infrastructure managed by third-party providers such as Amazon Web Services, Microsoft Azure, or Google Cloud. Organizations share resources and pay based on usage. | Supermicro |
| Private cloud | Infrastructure is dedicated to one organization and may be hosted on-premises or by a third party. It provides greater control, security, and compliance. | Supermicro |
| Hybrid cloud | Combines public and private environments so workloads and data can move between them based on security, performance, and cost requirements. | Supermicro |
| Multi-cloud | Uses services from multiple public cloud providers to reduce vendor dependence and optimize resilience, cost, or performance. | Supermicro |
How Can Brightlio Help With Cloud Services?
Brightlio’s cloud services include cloud resource procurement, architecture and migration support, billing analysis, cost optimization, and security guidance.
Brightlio can also coordinate colocation, network connectivity, and unified communications solutions when cloud workloads depend on reliable facilities, internet access, and collaboration platforms.
Contact Brightlio to discuss a cloud infrastructure or cost-optimization project.
For related infrastructure data, see Brightlio’s data center statistics for 2026.
FAQs
Amazon Web Services remains the largest provider. In Q2 2026, AWS held 28% of the global cloud infrastructure services market; Microsoft held 20% and Google held 15%.
Yes. Netflix completed its cloud migration in January 2016, and its streaming platform runs on AWS.
Gartner forecasts the worldwide public cloud services market to reach $1.03 trillion in 2026, representing 20.9% year-over-year growth.
There is no single authoritative worldwide company count. In Flexera’s 2026 global survey of more than 750 cloud decision-makers and users, 88% of represented organizations used multi-cloud environments. Separately, Eurostat found that 52.7% of EU enterprises purchased paid cloud services in 2025.
Among organizations represented in Flexera’s 2026 survey, 88% used multi-cloud environments and 73% operated hybrid cloud estates. The report also found that 63% of SMB workloads ran in the public cloud.
Grand View Research estimates the global cloud computing market at $1.19 trillion in 2026. Synergy Research Group reports $143.4 billion in cloud infrastructure service revenue in Q2 2026, while Gartner forecasts worldwide IaaS spending of $287 billion for the year.

Tamzid is a cybersecurity researcher with 5+ years of experience across SaaS, security, compliance, data centers and cloud. He writes for brightdefense.com and hipaasimple.com, covering security, compliance, and infrastructure topics. Certified through Cisco, Fortinet (NSE 1), and the Basel Institute on Governance in OSINT, he grounds his work in primary sources and verified data.
Recent Posts

Data Centers In Pennsylvania

Data Centers In Nebraska

Data Centers In Mississippi

Data Centers In Indiana
Let's start
a new project together