
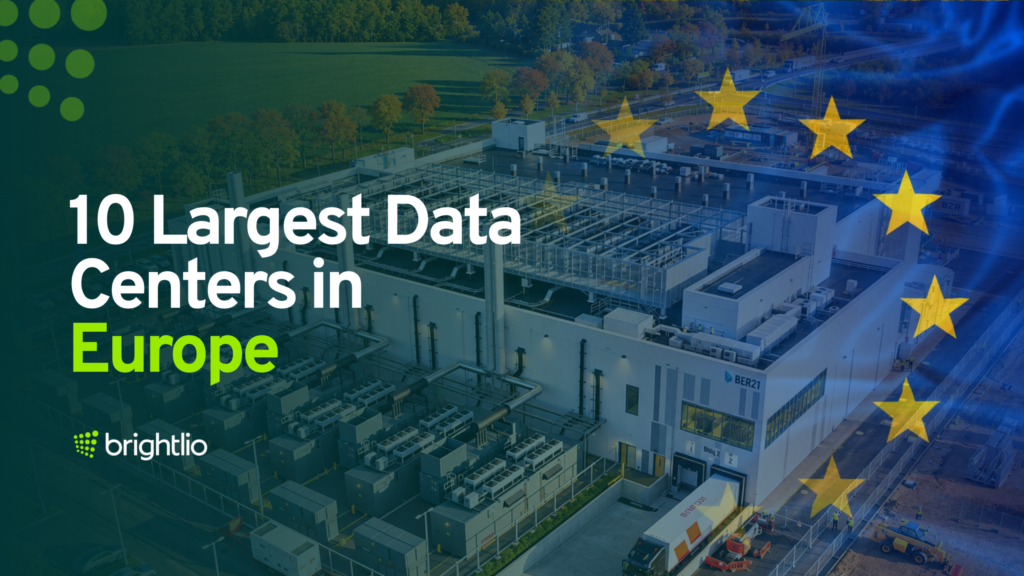
Europe’s largest data centers bring together substantial electricity capacity, server space, cooling infrastructure, and network connectivity. They support cloud platforms, enterprise systems, artificial intelligence, and other workloads that need room to grow.
Major operating examples include DATA4’s Paris-Saclay campus, Vantage’s CWL1 campus in Wales, Green Mountain’s OSL-Hamar, Lefdal Mine, and NTT DATA’s Frankfurt 1. Understanding what their published figures measure helps you compare them more accurately.
A campus power allocation, a commissioned IT load, and a building’s floor area measure different things. This guide compares five large operating European sites using publicly documented figures reviewed in October 2026.
Read on to explore the facilities, understand their capacity, and see what a large campus can offer your business.
10 Largest Data Center Sites In Europe
DATA4 Paris-Saclay, Vantage CWL1, Green Mountain OSL-Hamar, and the other sites below represent substantial data center developments across Europe. Their published figures measure different types of capacity, including campus power, critical IT capacity, and potential development capacity.
| No. | Data Center | Location | Documented Scale And Measurement |
| 1 | DATA4 Paris-Saclay PAR01 | Paris region, France | The operator publishes 250 MW of campus power capacity. |
| 2 | Vantage CWL1 | Newport, United Kingdom | CWL11 and CWL13 provide 112 MW of combined built capacity. |
| 3 | Green Mountain OSL-Hamar | Hamar area, Norway | Three operating buildings provide 90 MW of IT capacity. |
| 4 | Lefdal Mine Nordfjord | Western Norway | The facility has 80 MW of available power following a grid expansion. |
| 5 | NTT DATA Frankfurt 1 | Frankfurt, Germany | The specification lists 70.1 MW of critical IT capacity, with 7.3 MW under construction. |
| 6 | NTT DATA Frankfurt 3 | Rüsselsheim, Germany | The operator lists 60.5 MW of critical IT capacity. |
| 7 | CyrusOne AMS1 | Halfweg, Netherlands | Two buildings represent 54 MW of potential IT capacity. |
| 8 | NTT DATA London 1 | Dagenham, United Kingdom | The specification lists 32 MW of critical IT capacity, with 64 MW planned at full development. |
| 9 | atNorth DEN01 | Ballerup, Denmark | The operator publishes 30 MW of campus power capacity; the first phase is operational. |
| 10 | NTT DATA Berlin 2 | Berlin, Germany | Buildings A and B provide 24 MW of combined critical IT capacity. |
These figures describe infrastructure capacity rather than measured electricity consumption or customer occupancy. The following 10 facility profiles explain each site’s documented scale, capacity measurement, and development status.
1. DATA4 Paris-Saclay PAR01 In France
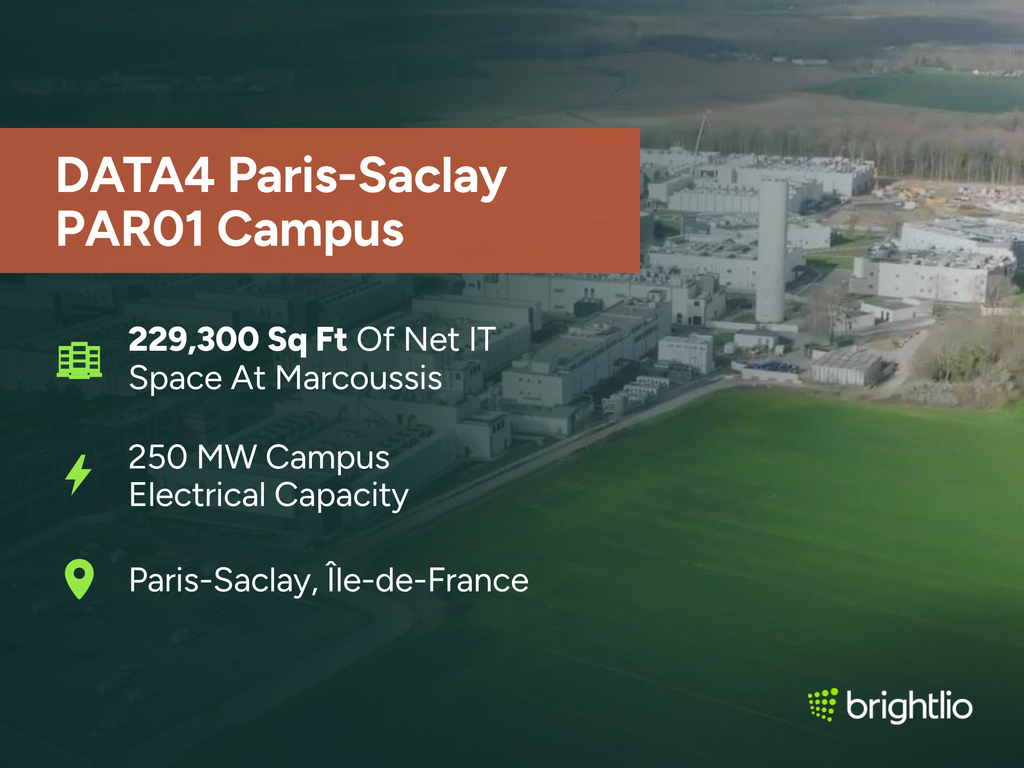
DATA4’s Paris-Saclay PAR01 campus in the Paris region has a published 250 MW campus power capacity. This figure describes the scale of the campus’s electrical provision and provides a reference point for assessing its overall development.
Campus power can support both computing equipment and the systems required to operate the facility. The 250 MW figure therefore does not confirm an equivalent amount of commissioned IT capacity or electricity currently consumed by servers.
An assessment of PAR01 should distinguish the campus rating from the capacity delivered within individual buildings. Customers considering a deployment need the power allocation and availability date for their specific space.
Key Capacity And Facility Details
- Location: PAR01 is in the Paris region of France.
- Power capacity: The campus has 250 MW of electrical capacity.
- Deployment consideration: Building-level availability requires separate confirmation.
- Facility area: The Marcoussis site has about 229,300 sq ft of net IT space.
2. Vantage CWL1 In Newport, United Kingdom
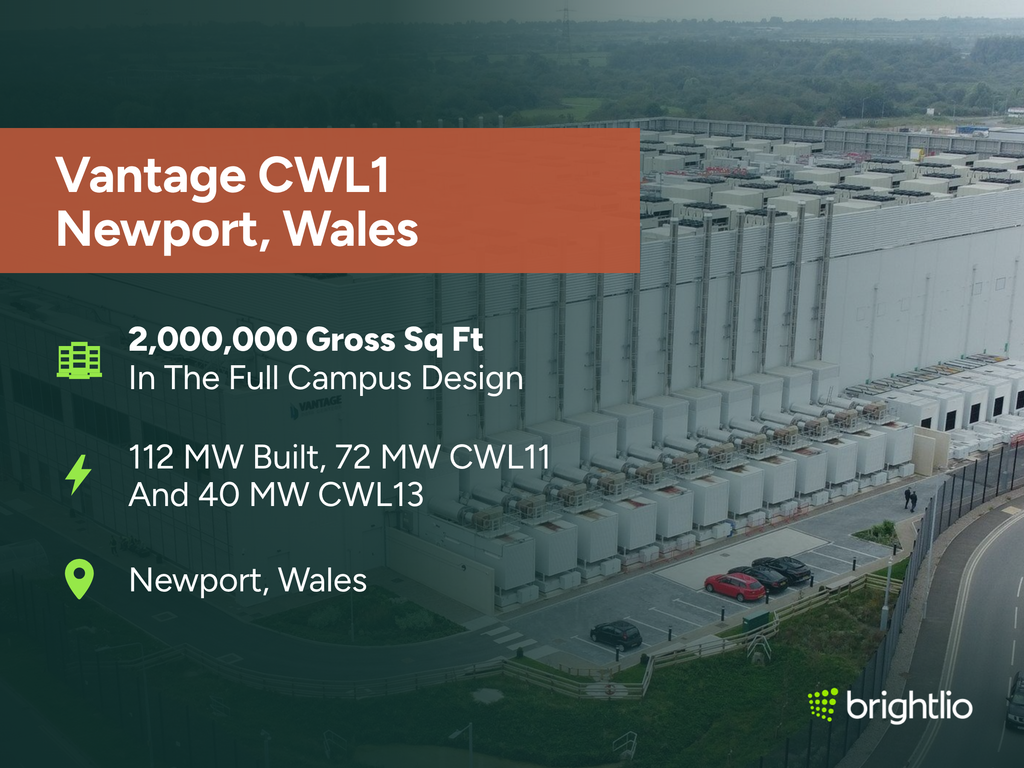
Vantage’s CWL1 campus in Newport, Wales, includes two operating buildings with 112 MW of combined built capacity. CWL11 accounts for 72 MW, and CWL13 contributes another 40 MW.
The building-level breakdown provides a more specific measure of completed infrastructure than a figure covering an entire future campus development. It ties the stated capacity to two named buildings.
Built capacity does not reveal how much space customers occupy or how much electricity their equipment consumes. Businesses evaluating CWL1 should assess available capacity within the relevant building, together with the timing and configuration of their proposed deployment.
Key Capacity And Facility Details
- Location: CWL1 is in Newport, Wales.
- Power capacity: CWL11 and CWL13 have 112 MW of combined built capacity.
- Building breakdown: CWL11 provides 72 MW, and CWL13 provides 40 MW.
- Facility area: The full CWL1 campus design covers 2,000,000 gross sq ft.
3. Green Mountain OSL-Hamar In Norway
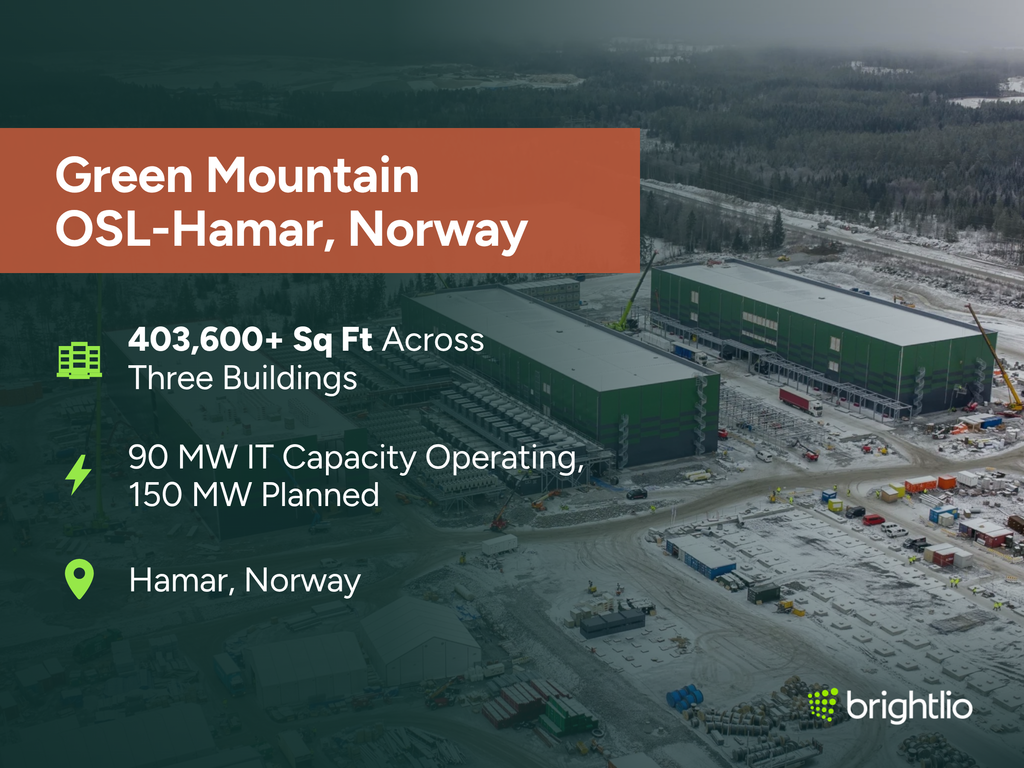
Green Mountain’s OSL-Hamar campus has 90 MW of IT capacity across three completed, operating buildings. The facility is in the Hamar area of Norway, with a planned expansion that would bring the campus to 150 MW.
IT capacity describes the electrical capacity allocated to computing equipment. This makes the operating 90 MW figure more specific to customer infrastructure than a campus rating that includes supporting facility systems.
The planned 150 MW total represents a separate development milestone. Comparisons of operating infrastructure should use the completed 90 MW figure and describe the additional capacity as planned expansion.
Key Capacity And Facility Details
- Location: The campus is in the Hamar area of Norway.
- Power capacity: Three completed buildings have 90 MW of IT capacity.
- Expansion plan: The campus is planned to reach 150 MW.
- Facility area: The three operating buildings cover more than 403,600 sq ft combined, with about 134,550 sq ft per building.
4. Lefdal Mine Nordfjord In Norway
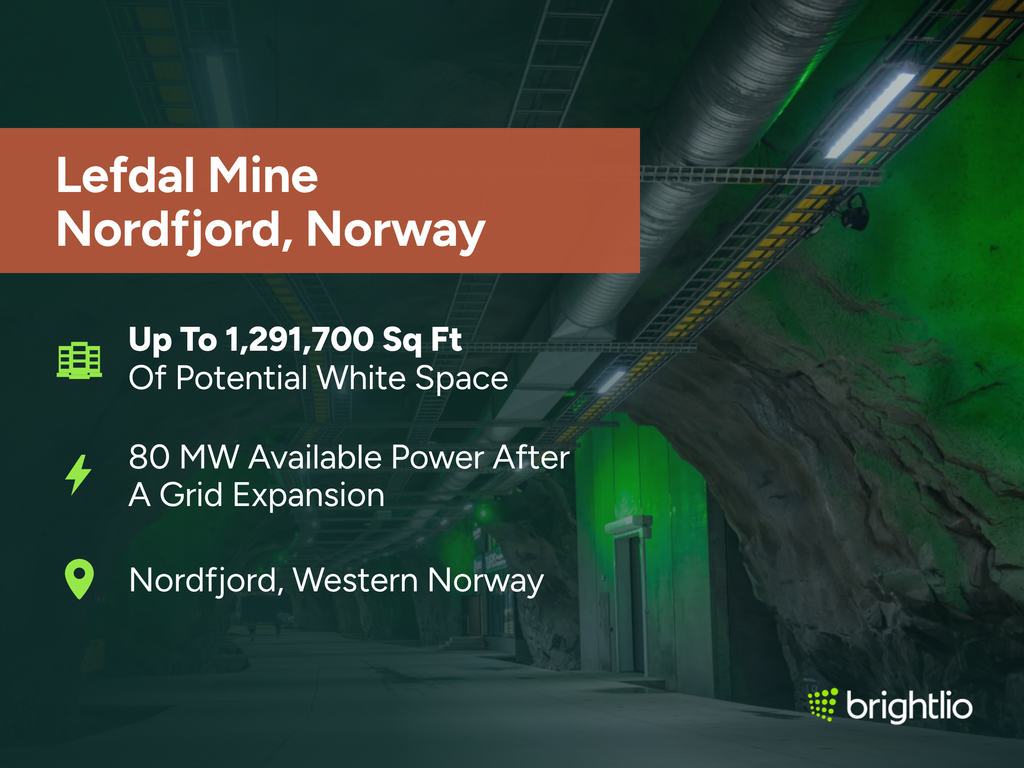
Lefdal Mine’s Nordfjord facility has 80 MW of available power following an expansion of its grid connection. The site is in western Norway, and the increased electrical supply supports its infrastructure development.
Available facility power describes the electricity accessible to the site. It does not confirm how much has been allocated to commissioned customer IT equipment or how much is currently in use.
The grid connection is an important part of the facility’s capacity, but customer deployments require corresponding data hall space, cooling, and power distribution. A proposal should specify the IT capacity available for the contracted environment and its delivery schedule.
Key Capacity And Facility Details
- Location: The facility is in the Nordfjord area of western Norway.
- Power capacity: The site has 80 MW of available power following a grid connection expansion.
- Deployment consideration: Customer-ready IT capacity requires confirmation for the proposed installation.
- Facility area: The mine has up to 1,291,700 sq ft of potential white space.
5. NTT DATA Frankfurt 1 In Germany
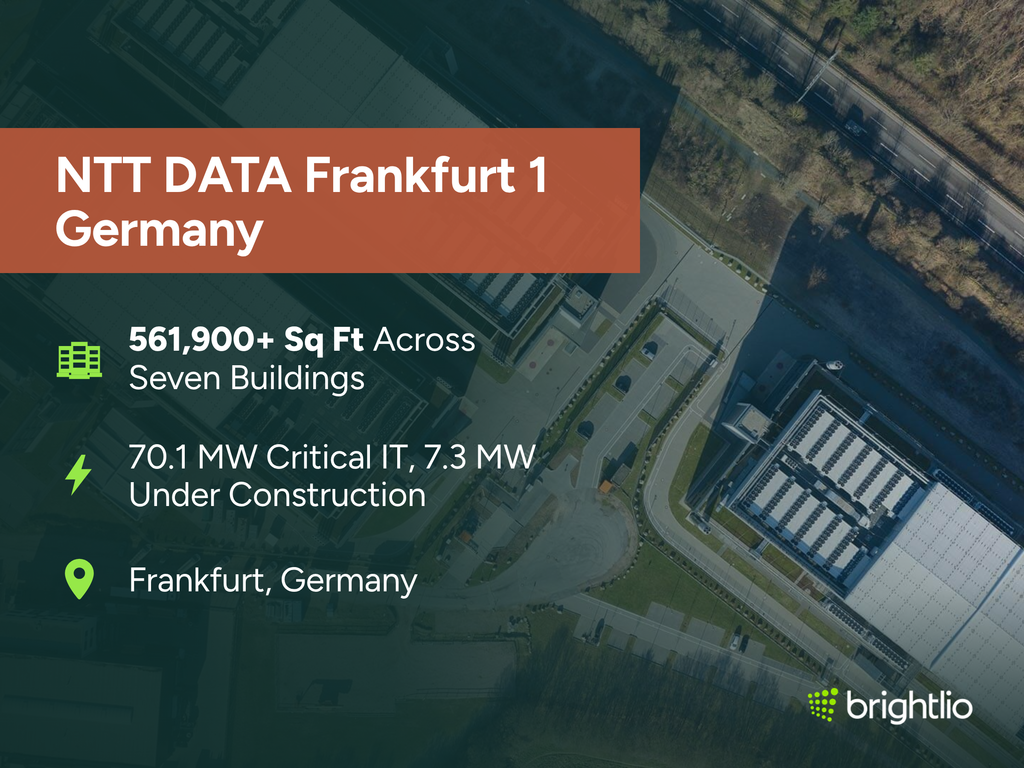
NTT DATA’s Frankfurt 1 specification lists 70.1 MW of critical IT capacity, with another 7.3 MW under construction. The facility is in Frankfurt, Germany.
Critical IT capacity describes the power provision for computing equipment. The specification separates the existing capacity from the additional infrastructure being built, giving readers a clearer view of the facility’s development stage.
The 7.3 MW expansion should remain outside the existing capacity total until it is delivered. Customers evaluating the site should confirm whether their proposed deployment uses existing infrastructure or depends on completion of the expansion.
Key Capacity And Facility Details
- Location: Frankfurt 1 is in Frankfurt, Germany.
- Power capacity: The facility has 70.1 MW of critical IT capacity.
- Construction activity: Another 7.3 MW is under construction.
- Facility area: Frankfurt 1 has more than 561,900 sq ft of IT space across seven buildings.
6. NTT DATA Frankfurt 3 In Germany
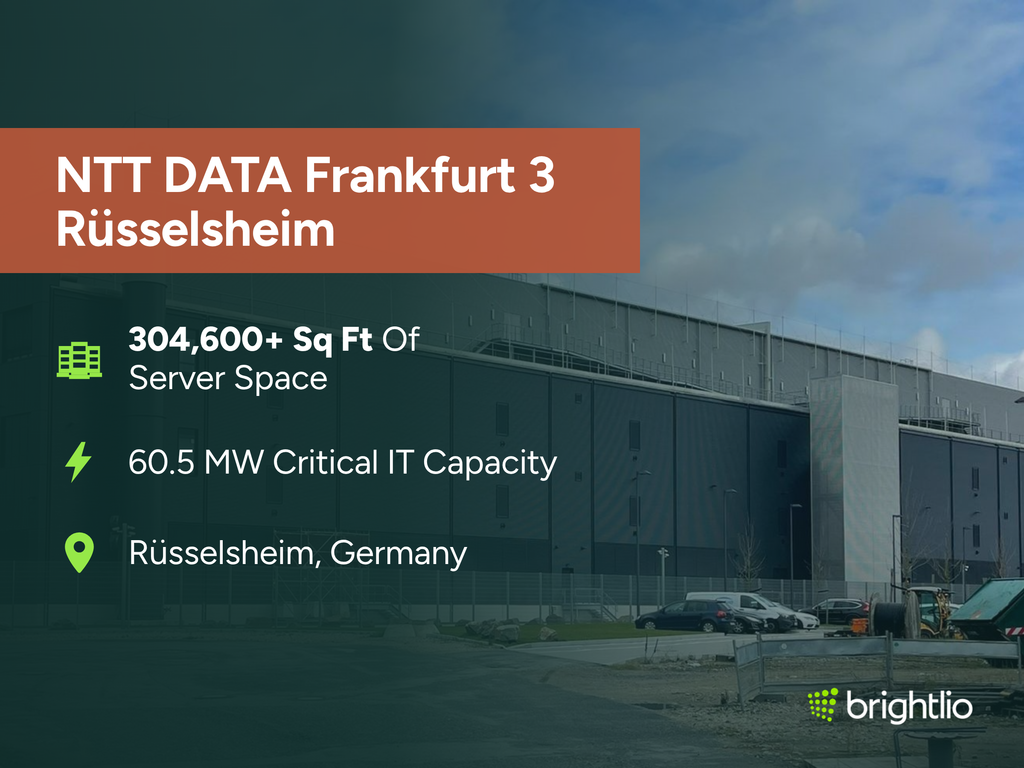
NTT DATA’s Frankfurt 3 facility in Rüsselsheim has a published 60.5 MW of critical IT capacity and more than 28,300 square meters of server space. The specification provides both an electrical capacity measure and a physical space measure.
These figures describe different aspects of the facility. Critical IT capacity measures the power available to computing equipment, and server space describes the area allocated to that equipment.
The campus totals do not determine the power density available within every customer area. Deployment planning should confirm the rack density, cooling provision, and space available for the intended equipment configuration.
Key Capacity And Facility Details
- Location: Frankfurt 3 is in Rüsselsheim, Germany.
- Power capacity: The facility has 60.5 MW of critical IT capacity.
- Facility area: The facility has more than 304,600 sq ft of server space.
- Deployment consideration: Rack density and available customer space require configuration-specific confirmation.
7. CyrusOne AMS1 In The Netherlands
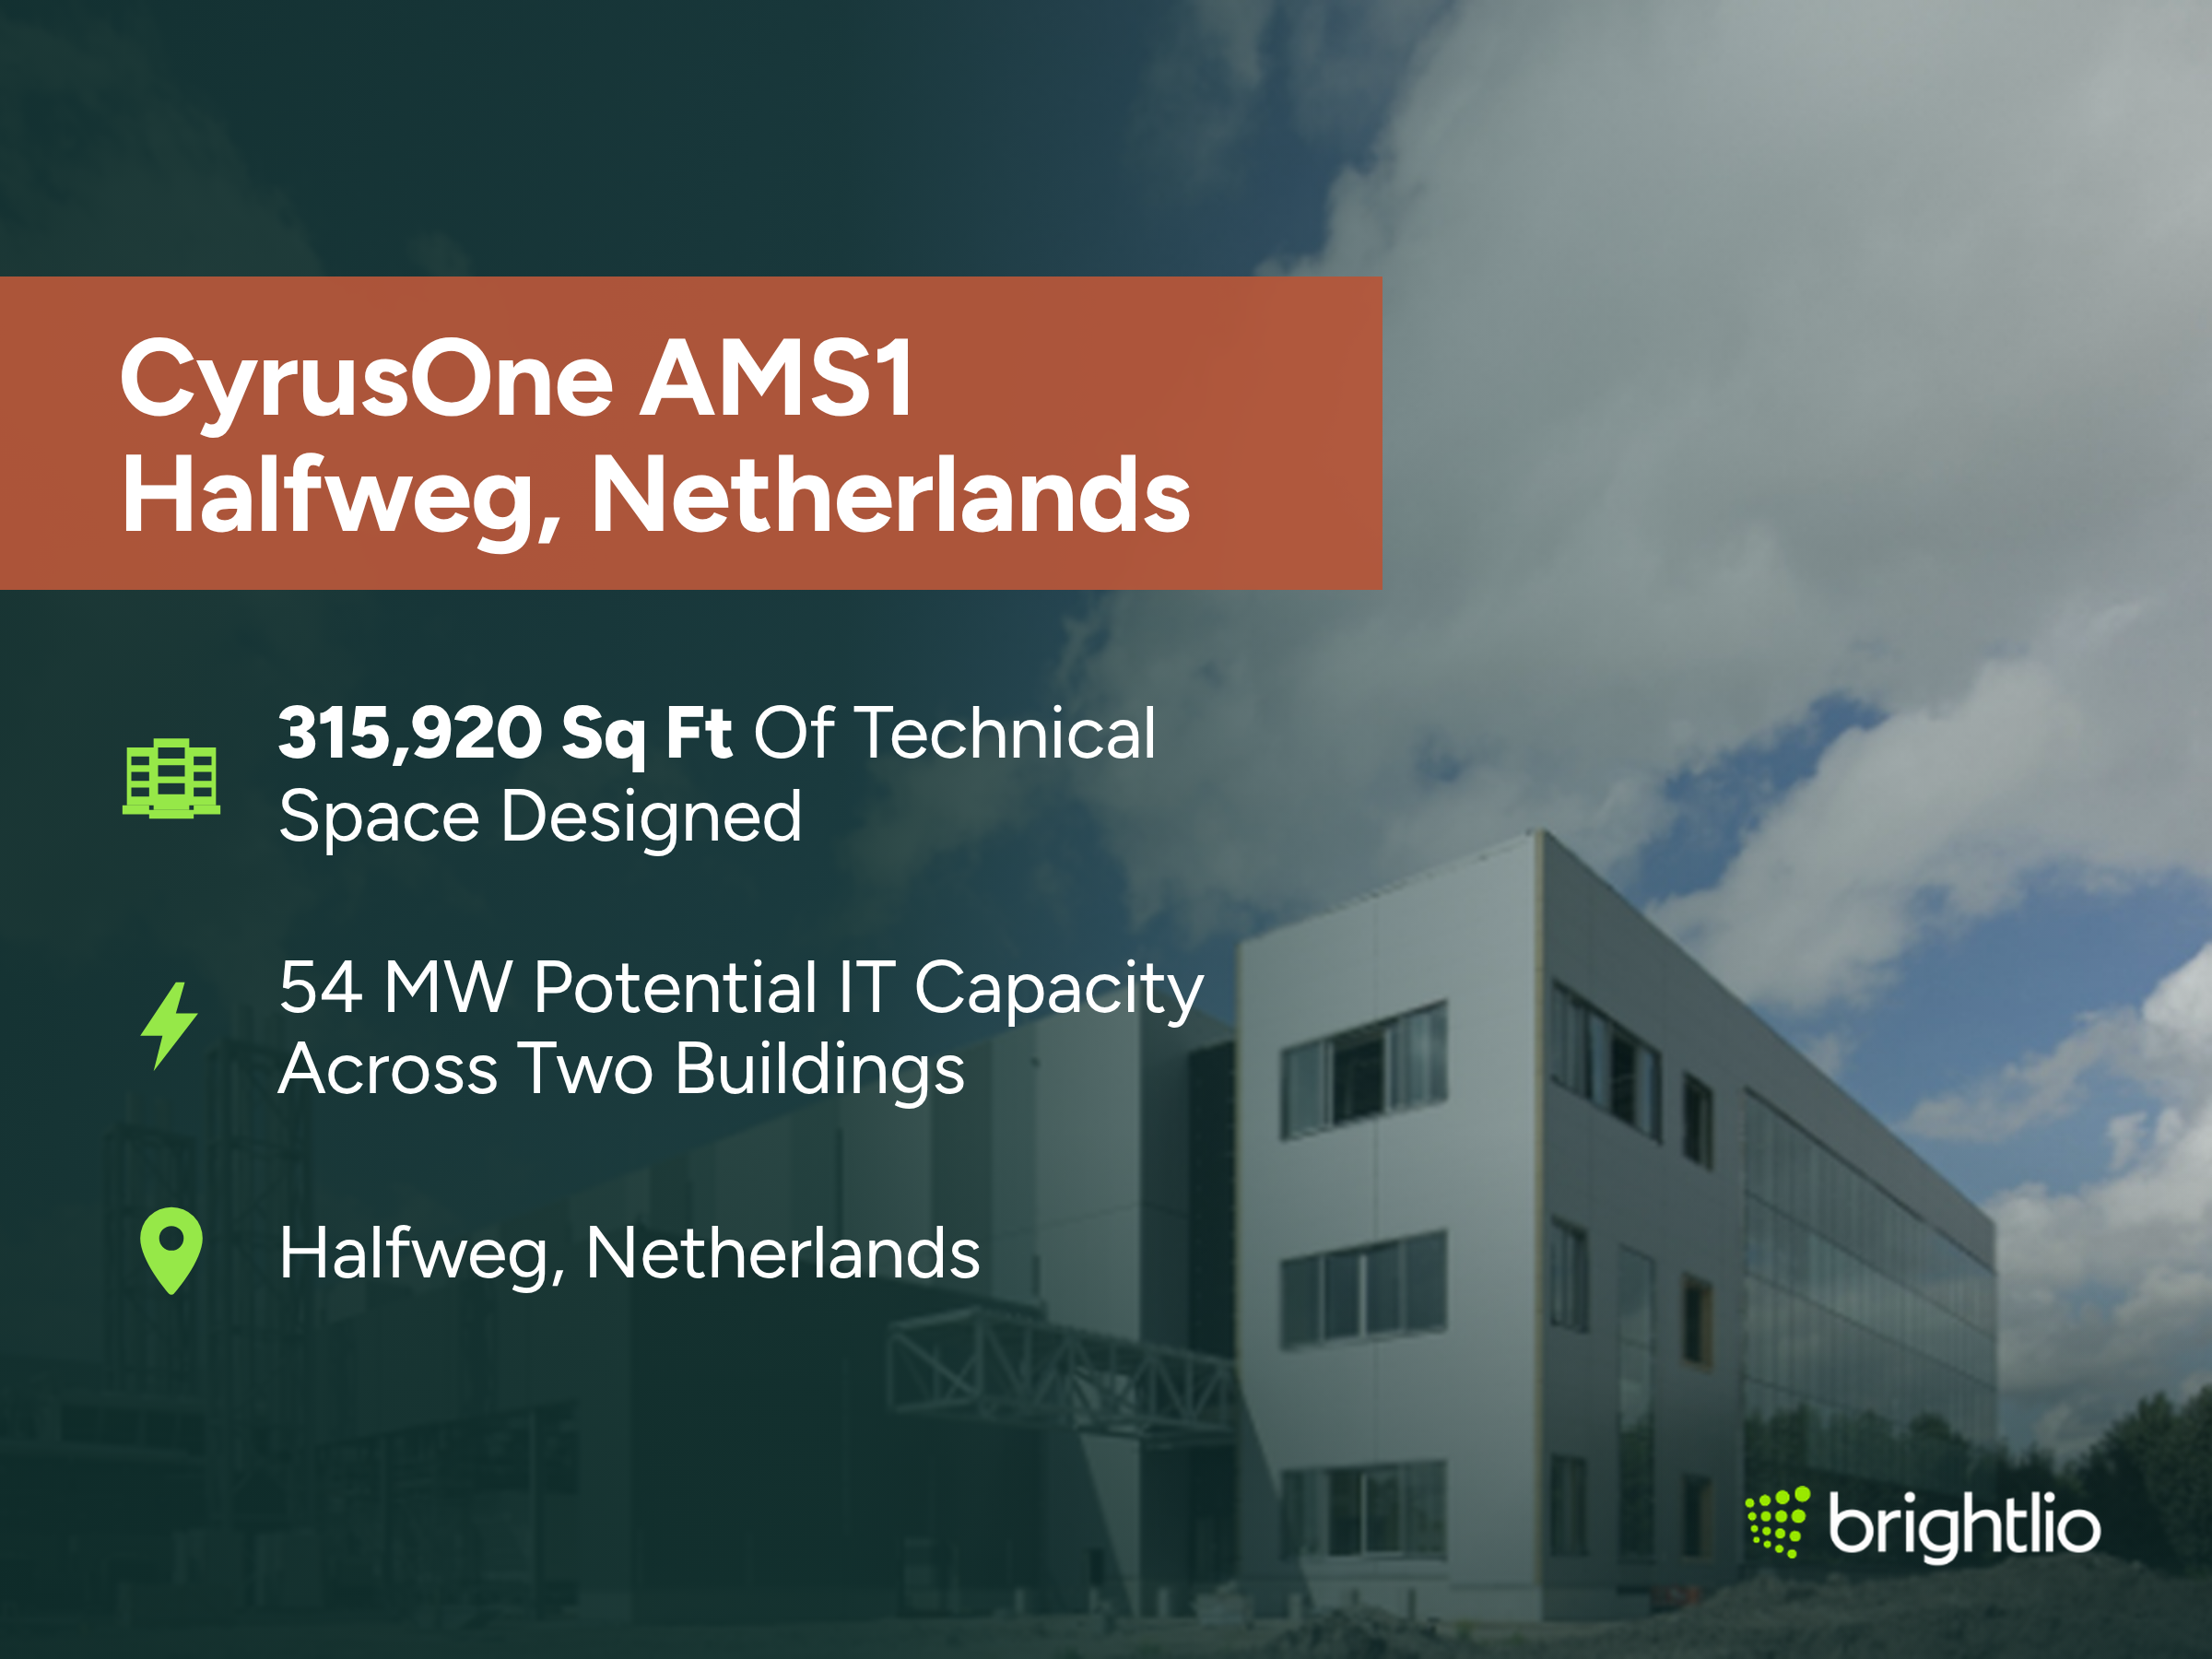
CyrusOne’s AMS1 campus in Halfweg has a published 54 MW of potential IT capacity across two buildings. The figure describes the campus development total.
Potential IT capacity indicates the scale the development can support. It does not, on its own, confirm that the entire 54 MW is commissioned, occupied, or available for immediate customer deployment.
AMS1 should therefore be assessed using both its published development capacity and the delivery status of individual buildings. Customers need confirmation of the capacity available at contract commencement and any later phases included in their proposal.
Key Capacity And Facility Details
- Location: AMS1 is in Halfweg, Netherlands.
- Power capacity: The two-building campus has 54 MW of potential IT capacity.
- Campus configuration: The capacity spans two buildings.
- Facility area: The two-building campus is designed for 315,920 sq ft of technical space.
8. NTT DATA London 1 In The United Kingdom
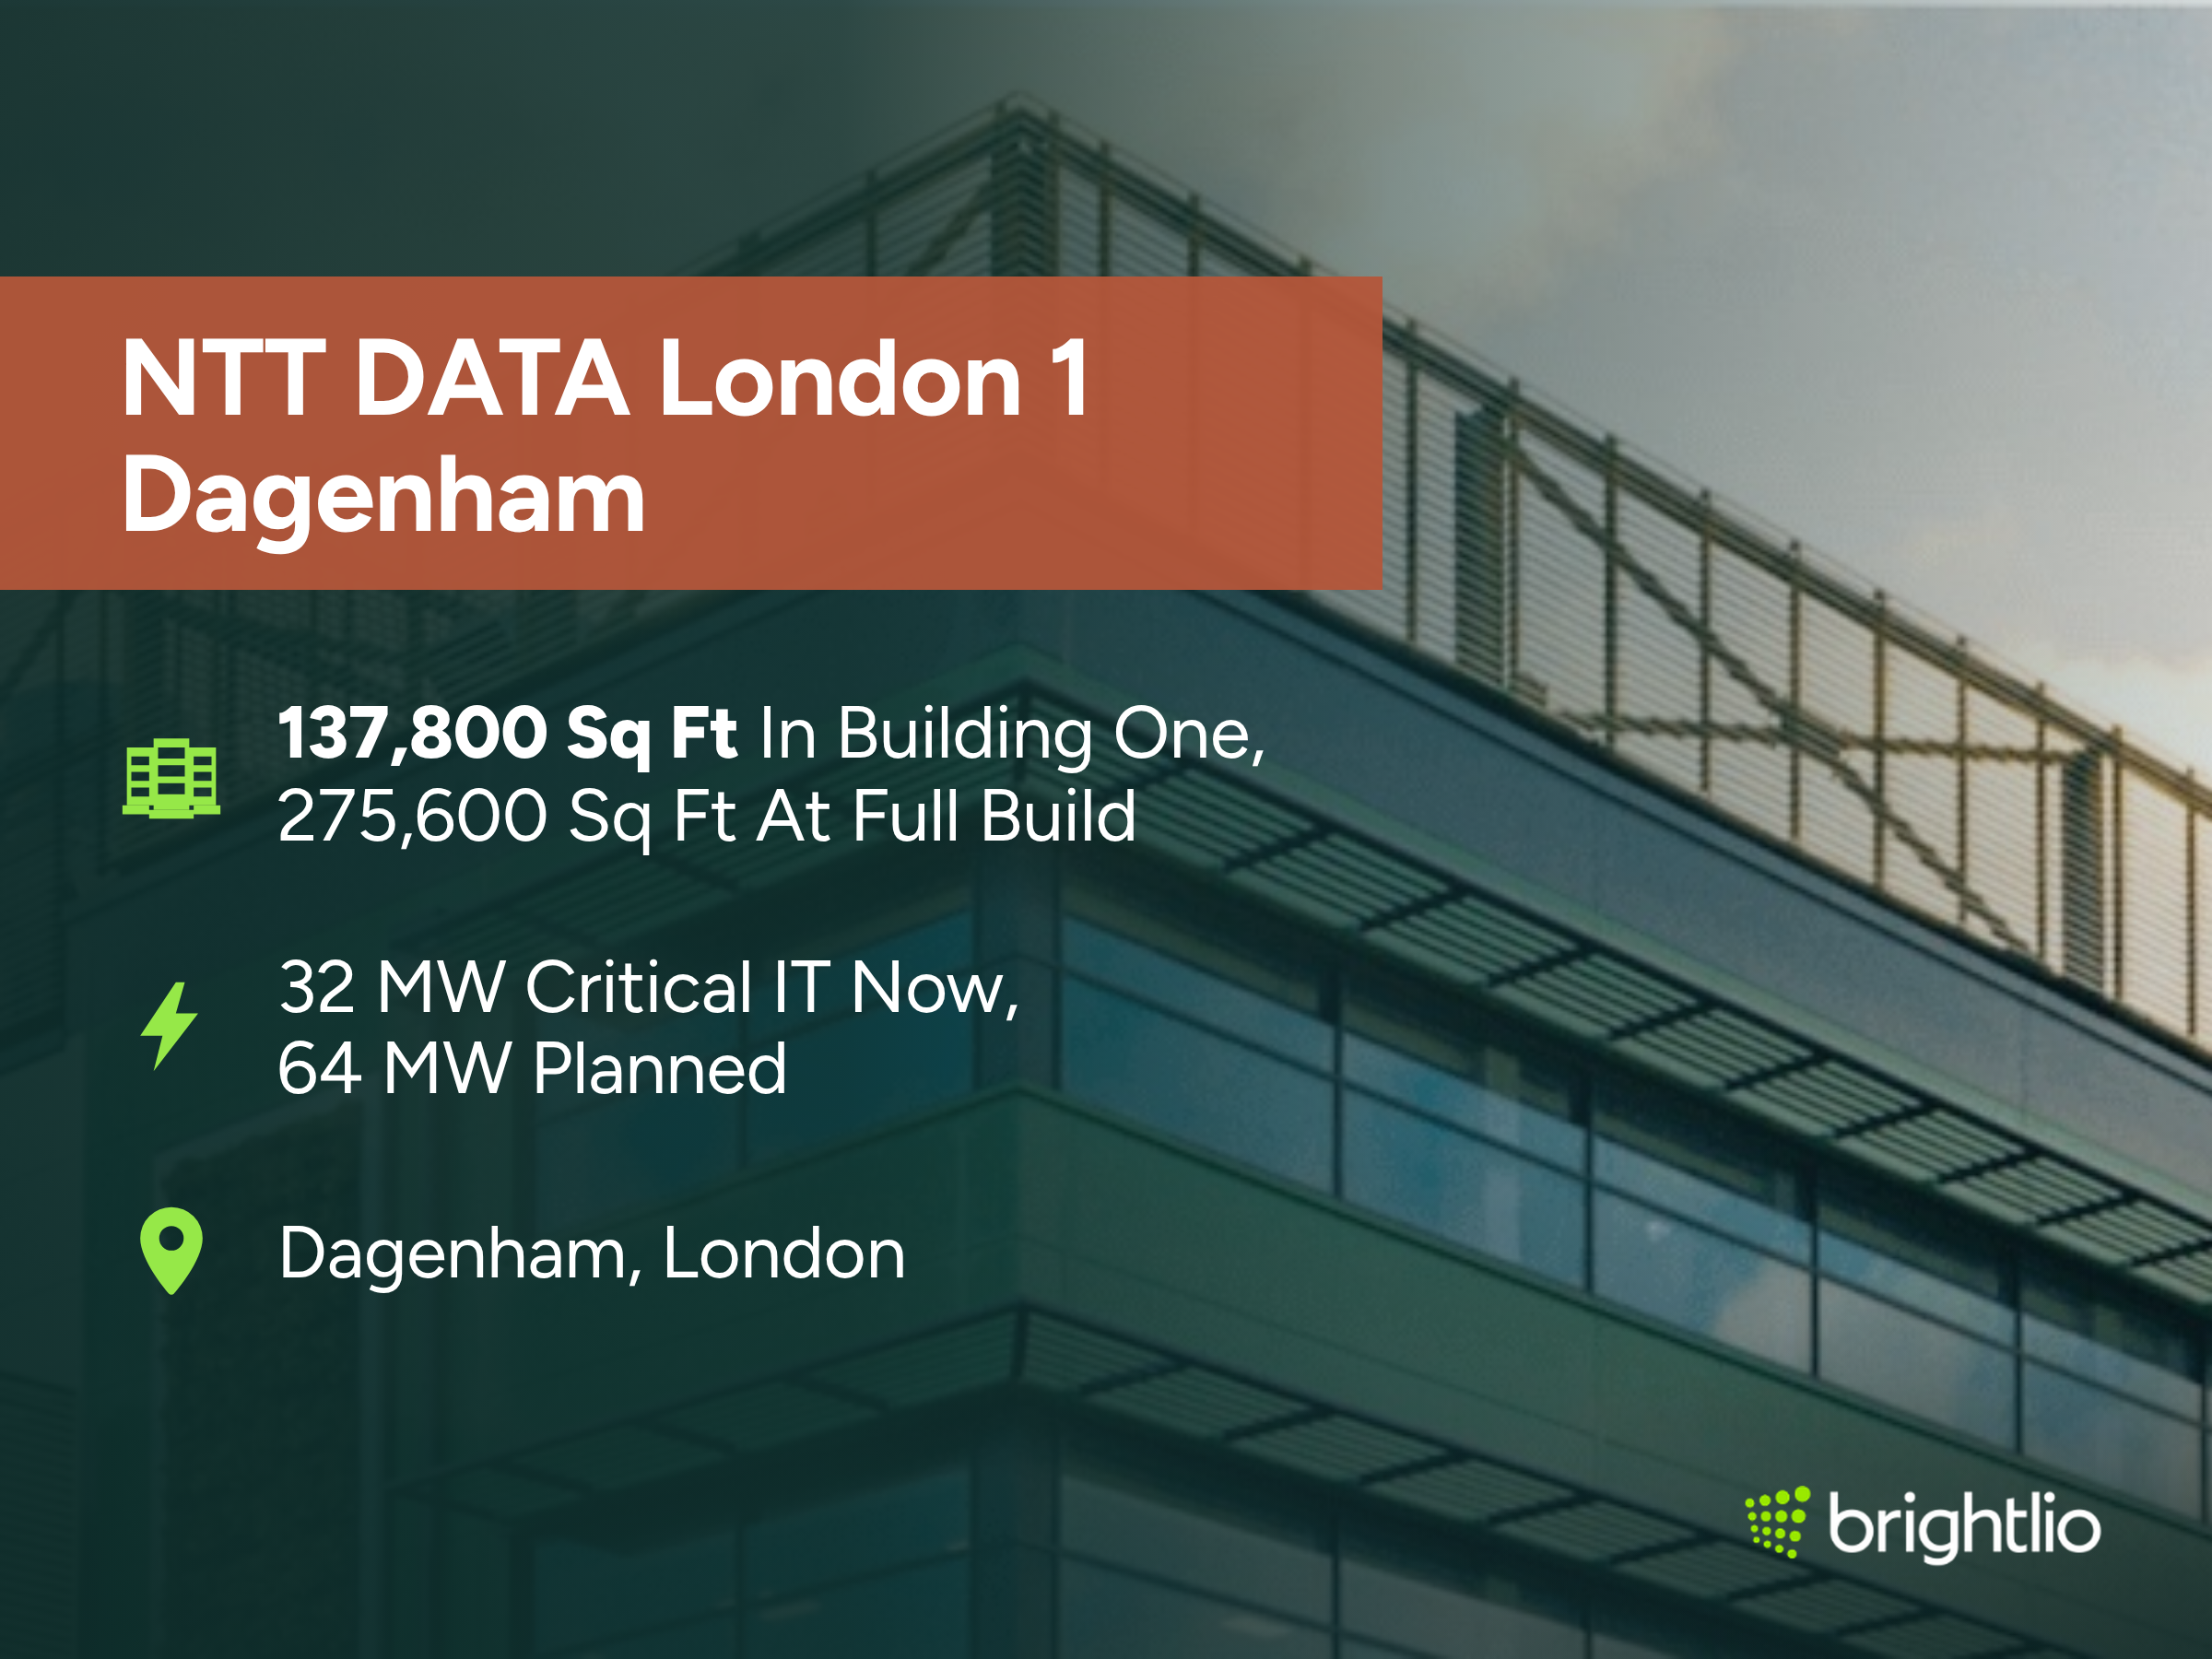
NTT DATA’s London 1 facility in Dagenham has 32 MW of critical IT capacity in its existing specification. The planned full development would provide 64 MW.
The two figures separate the existing infrastructure from the larger development target. The 32 MW figure is the appropriate reference for the capacity described in the existing specification.
Customers considering future growth should confirm when additional capacity will become available and whether their contract reserves any of it. A full-development target does not guarantee immediate access to the planned capacity.
Key Capacity And Facility Details
- Location: London 1 is in Dagenham, United Kingdom.
- Power capacity: The first building has 32 MW of critical IT capacity.
- Development target: The full development is planned to provide 64 MW.
- Deployment consideration: Expansion timing and reserved customer capacity require separate confirmation.
- Facility area: The first building has about 137,800 sq ft of server space; the full development is designed for 275,600 sq ft.
9. atNorth DEN01 In Denmark
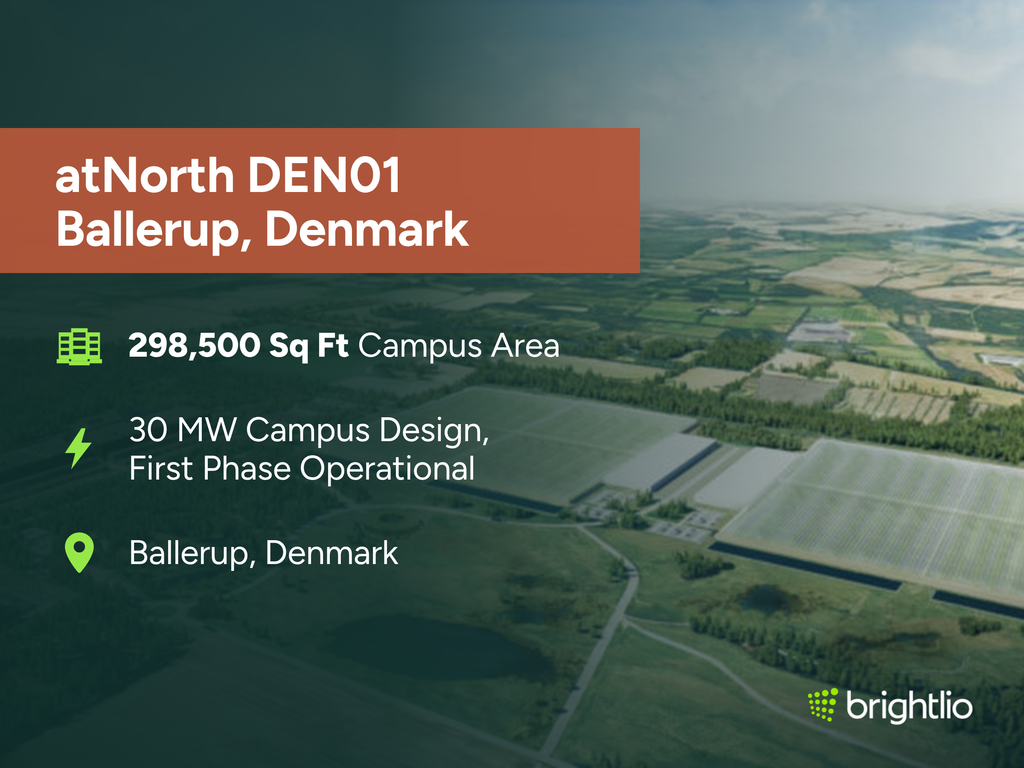
atNorth’s DEN01 campus in Ballerup has a published 30 MW campus power capacity. Its first phase is operational, placing the site within a phased development model.
The 30 MW figure describes campus power provision. It does not confirm that the entire campus is operational or that customers currently use 30 MW of IT capacity.
An assessment of DEN01 should distinguish the operational first phase from the overall campus rating. Customers should confirm the commissioned IT capacity available within their proposed deployment phase and the schedule for any additional infrastructure.
Key Capacity And Facility Details
- Location: DEN01 is in Ballerup, Denmark.
- Power capacity: The full campus is designed for 30 MW.
- Operating status: The first development phase is operational.
- Facility area: DEN01 covers about 298,500 sq ft.
10. NTT DATA Berlin 2 In Germany
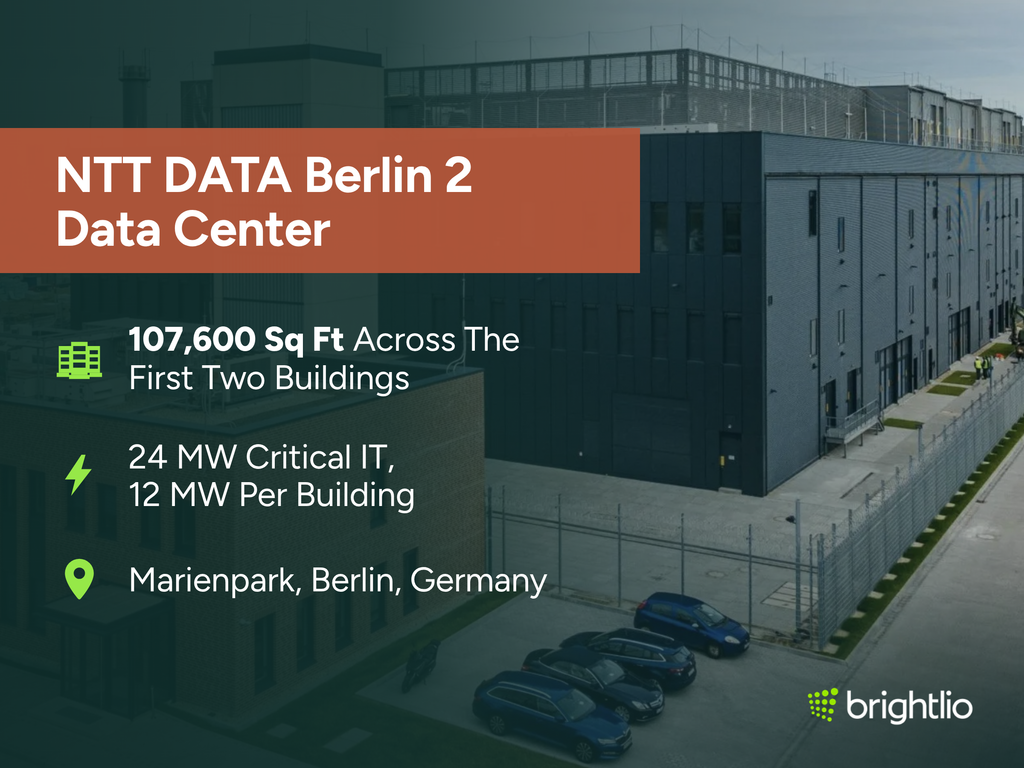
NTT DATA’s Berlin 2 facility provides 24 MW of critical IT capacity across Buildings A and B. Each building contributes 12 MW.
The specification ties the total to two defined buildings, making the capacity breakdown clear. The 24 MW figure measures the power provision for computing equipment across those buildings.
The published total does not indicate how much capacity remains available to new customers. Deployment discussions should confirm the selected building, available power allocation, and any requirements for distributing equipment across separate areas.
Key Capacity And Facility Details
- Location: Berlin 2 is in Berlin, Germany.
- Power capacity: Buildings A and B have 24 MW of combined critical IT capacity.
- Building breakdown: Each building contributes 12 MW.
- Deployment consideration: Available customer capacity requires confirmation within the selected building.
- Facility area: The first two buildings cover almost 107,600 sq ft of data center area.
How Do You Measure the Largest Data Centers
Start by checking which equipment, buildings, or land a figure covers. That prevents a large land reserve or a future grid connection from being mistaken for computing infrastructure already in service.
The following are four measures to understand:
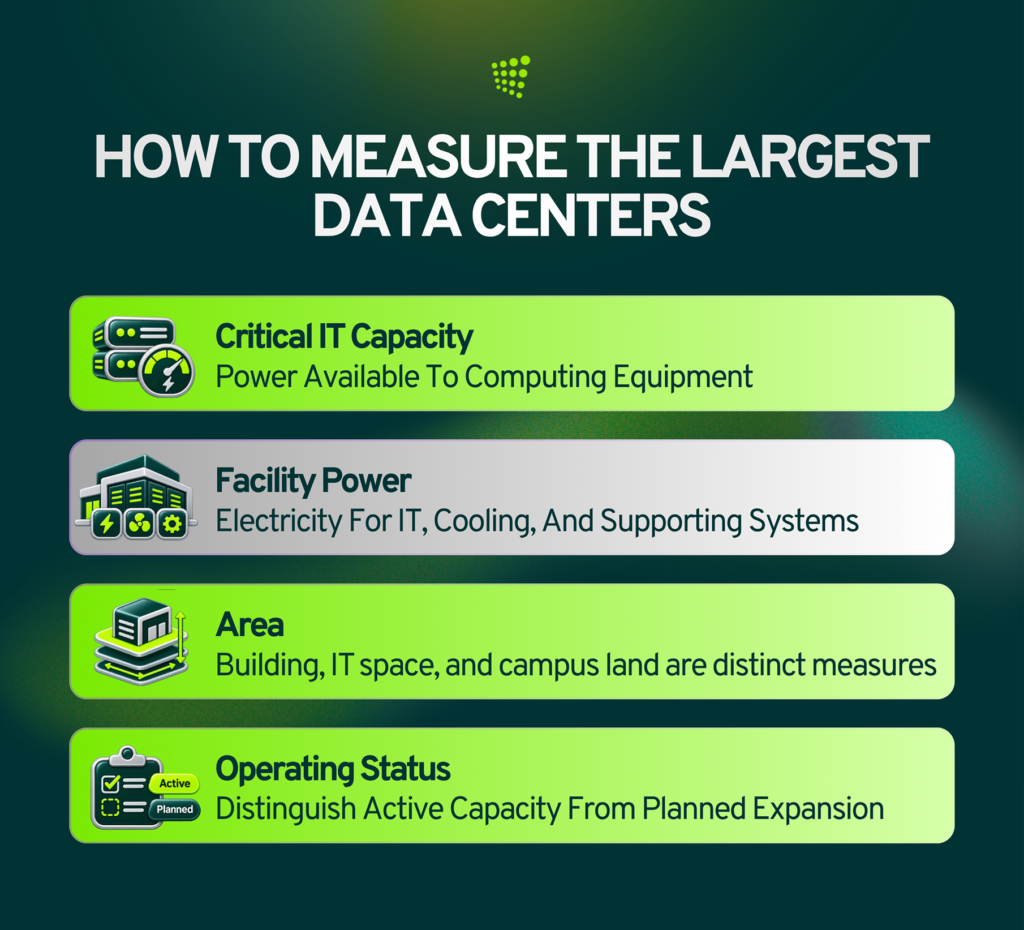
1. Critical IT Capacity
Critical IT capacity describes the power available to computing equipment such as servers, storage, and networking. It is commonly expressed in megawatts, or MW.
For a capacity comparison, confirm that the figure covers completed infrastructure and identify the buildings included. A design rating for a future phase should be separated from the IT capacity already delivered.
2. Total Facility or Campus Power
The complete site needs electricity for cooling, electrical distribution losses, and other supporting systems as well as the IT equipment. The total facility requirement is therefore larger than its IT demand for the same operating period.
A published site allocation may also cover reserves or infrastructure intended for later use. Ask whether the number represents a grid connection, installed electrical equipment, or commissioned data halls before comparing it with another facility’s IT load.
3. Floor Area and Land Area
Gross building area includes more than server rooms. Offices, electrical rooms, cooling equipment, circulation, and other services can occupy a substantial share of the footprint.
IT space, sometimes called white space, describes areas intended for computing equipment. Land area is a different measure again: a 100-hectare campus is not a 100-hectare server hall.
4. Operating Status
A campus can contain occupied buildings, completed but unoccupied rooms, infrastructure being fitted out, and undeveloped land. Those stages should be identified separately.
For your business, the relevant question is what the provider can deliver on your deployment date. The provider should commit to the power, cooling, and space your equipment requires on that date.
Where Are Large European Data Centers Located
Europe’s data center infrastructure includes established metropolitan markets and campuses positioned around access to power, land, and cooling resources. These locations can serve different types of demand.
Paris and Frankfurt illustrate the value of established business and network ecosystems. A company exchanging substantial traffic with local partners or cloud platforms may benefit from evaluating facilities within those markets.
Wales and Norway illustrate other operating models, including large dedicated campuses and sites outside the densest metropolitan clusters. Their suitability depends on the applications being hosted, the network connections available, and the practical requirements for support and maintenance.
For your business, start with the people and systems that need to reach the workload. Brightlio’s data center location guides can help you research markets before comparing individual providers.
What Are the Benefits of a Large Data Center Campus
A large campus can provide a platform for growth and access to specialized infrastructure. Those advantages depend on what the provider has built and the services included in your agreement.
The following are the four potential benefits:
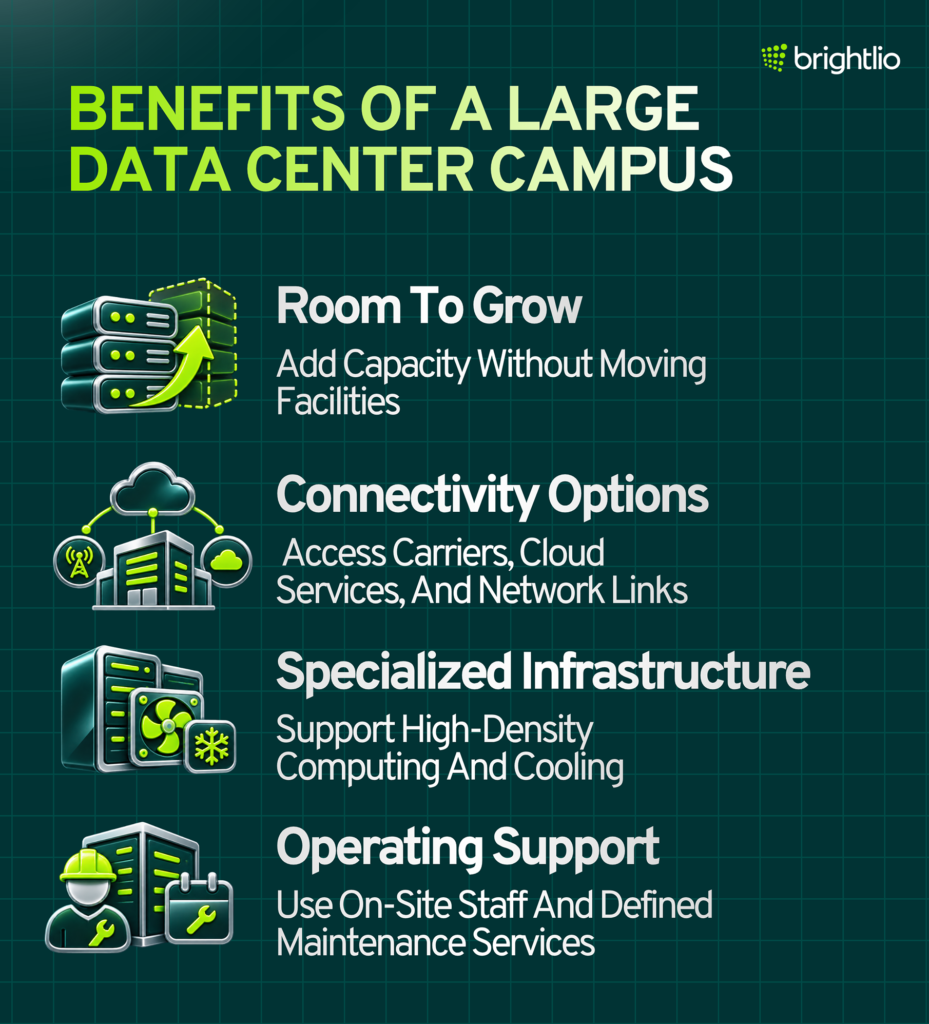
1. Room for Deployment Growth
A campus with available, completed capacity may allow you to add racks or expand into a larger space without moving to a different provider. That can simplify support and reduce the work associated with a migration.
Confirm how future capacity is reserved and when it becomes available. A statement that the campus has room to grow is different from a commitment to deliver your next deployment.
2. Access to Network and Cloud Services
Some large facilities bring together carriers, cloud connections, and service providers. This can give your business more options for linking infrastructure to customers, offices, and other environments.
The useful measure is the connectivity available in your specific building. Compare route diversity, service capacity, cross-connect charges, and the paths used to reach the systems your applications depend on.
3. Support for Specialized Computing
Large campuses may offer dedicated rooms, higher-density deployments, and different cooling configurations. These options can help organizations planning substantial computing environments.
AI and high-performance computing still require a detailed design review. Verify rack power, cooling connections, floor loading, network requirements, and maintenance access for the actual equipment you intend to deploy.
4. Established Operating Resources
A larger deployment can support dedicated teams, standardized maintenance procedures, and broader infrastructure services. These resources may help customers coordinate installations, repairs, and changes.
Evaluate the service directly. Staffing levels, response times, remote support, and change procedures should be defined in the proposal, with clear responsibility for the customer’s equipment.
What Challenges Should Buyers Evaluate
A large campus introduces choices around capacity, location, and the way the provider manages shared infrastructure. Your evaluation should connect those choices to the requirements of your applications.
The following are the five considerations:
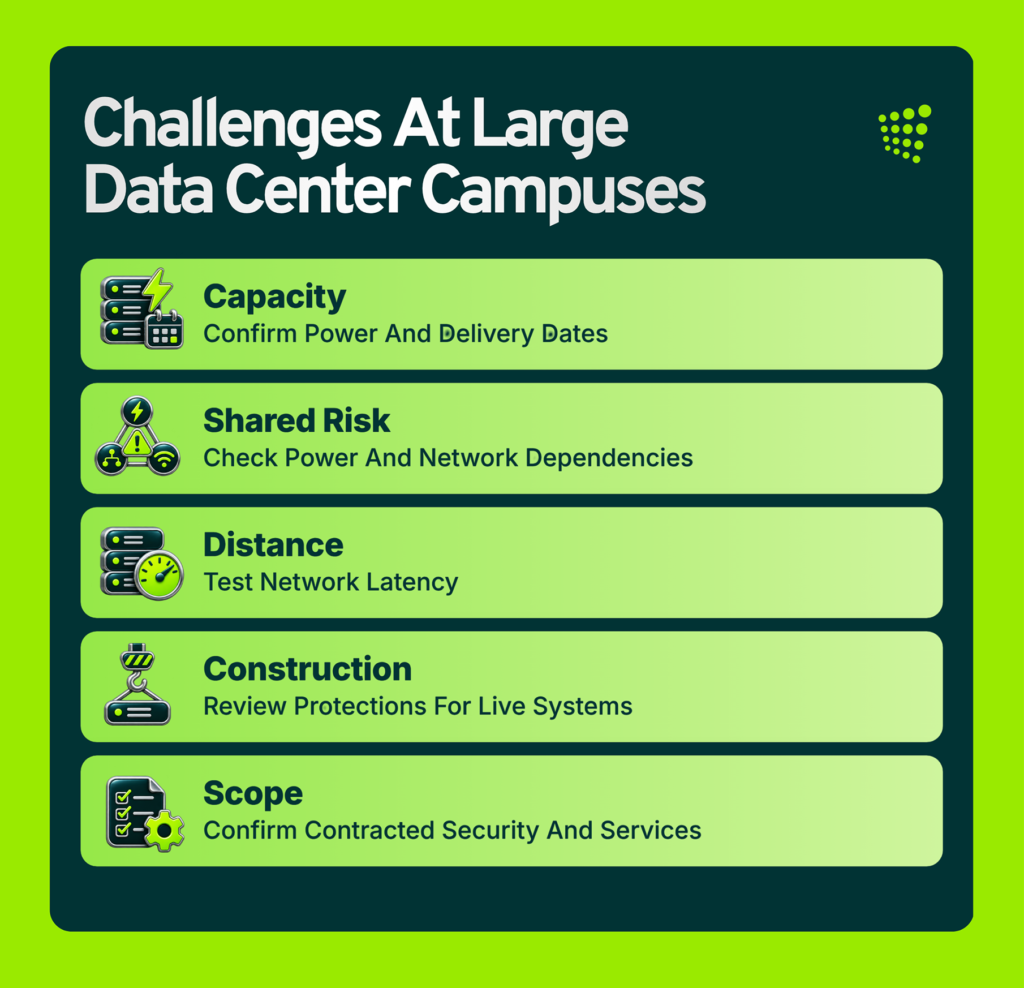
1. Availability of Contracted Capacity
Some operating facilities are fully committed to existing customers. Others may have space available but need additional electrical or cooling work before they can support your deployment.
Ask for the capacity that can be delivered to your racks, the readiness date, and any conditions affecting that commitment. The contract should state whether later expansion capacity is reserved, optional, or subject to availability.
2. Concentration of Operational Risk
Putting more equipment on one campus can simplify operations, but it also concentrates workloads in one location. Shared power systems, network routes, or administrative services can affect more than one building.
If you need a recovery site, assess its independence from the primary environment. Two buildings on the same campus should not automatically be treated as geographically separate disaster recovery locations.
3. Network Performance and Distance
A location with abundant power may be farther from users, offices, or other systems. The effect depends on latency, bandwidth, routing, and how often the application exchanges information.
Test representative traffic before making the decision. A workload running long, independent computing jobs can have different network requirements from an application that continually exchanges small requests with a distant database.
4. Maintenance During Ongoing Development
A campus can remain operational while neighboring areas are being fitted out or upgraded. Customers need to understand how the provider manages construction access, utility changes, and maintenance around live systems.
Review notification procedures and the protections covering your deployment. The relevant issue is how work is planned and controlled while your applications remain in service.
5. Security and Contract Scope
A campus-wide description does not establish the access controls, support arrangements, or assurance covering every service. Shared racks, private cages, and dedicated rooms can have different operating boundaries.
Match the legal entity, facility, and service in the proposal to the evidence you review. Brightlio’s guide to colocation provides a starting point for understanding the hosting arrangement and responsibilities.
How Should You Compare Large European Facilities
Use the same workload and service requirements for every proposal. That makes a comparison more useful than choosing a provider from a headline power figure alone.
The following table connects common claims to the evidence you need:
| Provider claim | What to establish | Why it matters |
|---|---|---|
| Large campus capacity | Completed IT capacity available to your deployment | Shows whether the provider can support the workload on time |
| High rack density | Supported density and cooling in the contracted room | Determines compatibility with your equipment |
| Strong connectivity | Carriers, physical routes, capacity, and charges | Affects performance, resilience, and recurring cost |
| Reliable operations | Maintenance design, test evidence, and support commitments | Helps assess how interruptions are handled |
| Efficient infrastructure | Measured energy and water performance with clear boundaries | Makes sustainability and cost claims easier to compare |
Before signing, confirm the deployment date, committed power, service boundaries, incident notification process, and exit arrangements. A clear contract connects the campus’s infrastructure to the service your business will actually receive.
Are the Largest Data Centers More Cost Effective?
A large operator may benefit from buying power, equipment, and services at scale. The price offered to your business still depends on the location, capacity commitment, density, contract term, and support requirements.
Compare the complete recurring bill, including power, bandwidth, cross-connects, remote support, and any minimum charges. Brightlio’s colocation pricing guide explains the cost components to review when comparing providers.
Energy efficiency also needs a consistent measurement. Power usage effectiveness, or PUE, is total facility energy divided by IT equipment energy over the same period.
For an illustrative example, a workload averaging 10 MW of IT demand would use 12 MW of total facility power at an annual PUE of 1.2. At an annual PUE of 1.4, the same average IT demand would require 14 MW of total facility power. Over a 365-day year, that difference equals 17,520 megawatt-hours.
These are hypothetical figures. A buying decision should use the provider’s actual measurement boundaries, charging method, and contractual power allocation rather than assume that a larger site has lower overhead.
Are Large European Data Centers More Sustainable?
Size alone does not determine environmental performance. Electricity sourcing, equipment utilization, cooling, water demand, construction, and the operating life of the infrastructure all influence the result.
Review claims about renewable electricity together with the procurement method and accounting period. An annual purchasing arrangement and a supply matched to consumption in every hour describe different outcomes.
Water reporting also needs context. A cooling system may have low consumption while withdrawing and returning water, and a low PUE does not by itself show water use or carbon emissions.
For your business, the useful comparison uses measured results from the relevant site and a consistent reporting boundary. Ask how the provider allocates electricity and environmental information to your contracted service.
Find the Right European Data Center With Brightlio
Choosing a European data center starts with your workload, deployment date, connectivity, and growth plans. Brightlio helps businesses evaluate colocation, cloud, and connectivity options against those requirements.
Whether you need a small cabinet deployment or a larger dedicated environment, the right provider should offer a clear view of available capacity, pricing, and service commitments. Contact Brightlio to discuss your requirements and explore suitable solutions.
Frequently Asked Questions
1. What Is the Largest Data Center in Europe?
The answer depends on the measure. DATA4 PAR01 publishes 250 MW of campus power capacity, while other sites publish commissioned IT capacity or building area. A reliable comparison must use the same metric and identify the operating infrastructure included.
2. Is a Data Center Campus the Same as One Building?
No. A campus can contain several data center buildings with shared services or infrastructure. A single-building comparison should not include the area or capacity of neighboring facilities without clearly stating that broader boundary.
3. Does Campus Power Equal IT Capacity?
No. Facility power also supports cooling, electrical losses, and other systems. A campus allocation can include additional reserves, so ask for the commissioned IT capacity available to your deployment.
4. Can Your Business Rent Space in Every Large Campus?
No. Some campuses are dedicated to a single tenant or serve only the operator’s own cloud platform. Commercial availability depends on the provider, the service model, and the capacity committed to existing customers.
5. Are the Largest Facilities Automatically Best for AI?
No. AI suitability depends on rack power, cooling, networking, and the supported equipment configuration. Confirm those requirements for the actual room being offered, regardless of the size of the wider campus.
6. Should Planned Capacity Be Included in an Operating Comparison?
Planned or unfinished capacity should be identified separately. For an immediate deployment, compare completed infrastructure and the provider’s commitment to deliver your contracted space and power on time.

Tamzid is a cybersecurity researcher with 5+ years of experience across SaaS, security, compliance, data centers and cloud. He writes for brightdefense.com and hipaasimple.com, covering security, compliance, and infrastructure topics. Certified through Cisco, Fortinet (NSE 1), and the Basel Institute on Governance in OSINT, he grounds his work in primary sources and verified data.
Recent Posts

Nuclear Powered Data Centers

10 Largest Data Centers in Europe

Data Centers and Colocation In Minnesota

Data Centers and Colocation In Missouri
Let's start
a new project together